Table of Contents [expand]
Last updated March 30, 2026
To provide more visibility into the Go runtime, the Go language metrics feature surfaces additional language-specific time series metrics within Application Metrics. These metrics include:
- Heap memory usage
- Heap object count
- Stack memory usage
- Aggregate GC collection count
- Aggregate GC stop the world time
- Aggregate goroutine count
This feature is currently in public beta.
Go language metrics are available for all dynos except for eco dynos.
General Information
For general information on metrics display settings, please refer to the language runtime metrics parent document.
Getting Started
There are 4 steps required to enable Go language metrics.
Enable the Enhanced Language Metrics feature by following these instructions.
The runtime environment variable enabled by the
runtime-heroku-metricsflag is only available inside a running dyno and does not appear in the application’s configuration.Opt into the public beta for Go Language metrics. You can either do this in Dashboard through the metrics preferences pane, or by running this command via the CLI:
heroku labs:enable "go-language-metrics" -a "my-app-name"The beta flag will not appear in the labs panel if you are not using the Go buildpack to build and deploy your application. But any Go application, no matter how it’s built and deployed to Heroku, can still use this feature by enabling the two flags above and using the package listed below.
Use the Heroku provided hmetrics/onload package, which periodically reports metrics to Heroku. Fetch the package into your application via
go get github.com/heroku/x/hmetrics/onload. In each main package you want instrumented, use a blank identifier import of the onload package like so:import _ "github.com/heroku/x/hmetrics/onload".Commit your updated code and push it to your Heroku application.
Additional examples and alternative ways to initialize the hmetrics library are available in the docs.
Available Metrics
It may take a few minutes for these metrics to become available after the steps above are completed.
Heap Memory Usage
This chart plots, in megabytes (MB) the overall memory quota; the maximum and average heap memory usage (runtime.Memstats’ HeapAlloc); and the maximum and average GC goal (runtime.Memstats’ NextGC), across all dynos in the currently selected process type.
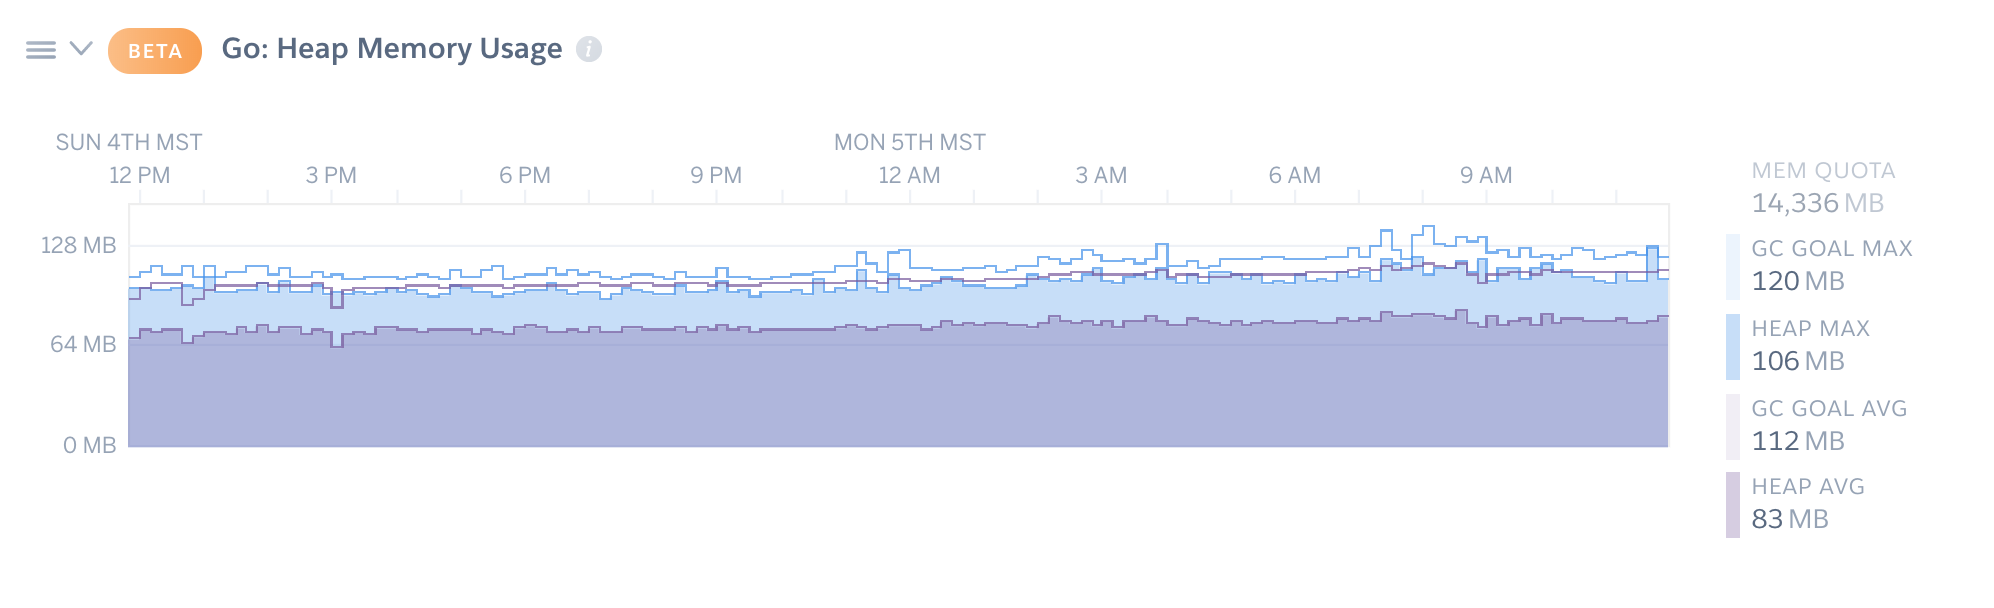
In the above example, to better view the relative usage of GC goal and heap metrics, the memory quota has been toggled off by clicking on the legend entry.
How to use this chart
A large gap between heap maximum and averages may indicate a memory issue on one or more dynos. Depending on the work pattern for a given process type it may indicate an un-even distribution of work, especially if the work is memory intensive. Large gaps between heap and goal may indicate a lot of churn (many short lived objects). This could be backed up with larger than necessary GC stop-the-world times. If you feel you have an issue and have access to heroku exec use tools like gops and it’s pprof support to help diagnose.
Stack Memory Usage
This chart plots, in megabytes (MB) the overall memory quota and the maximum and average stack memory usage (runtime.Memstats’ StackInuse), across all dynos in the currently selected process type.
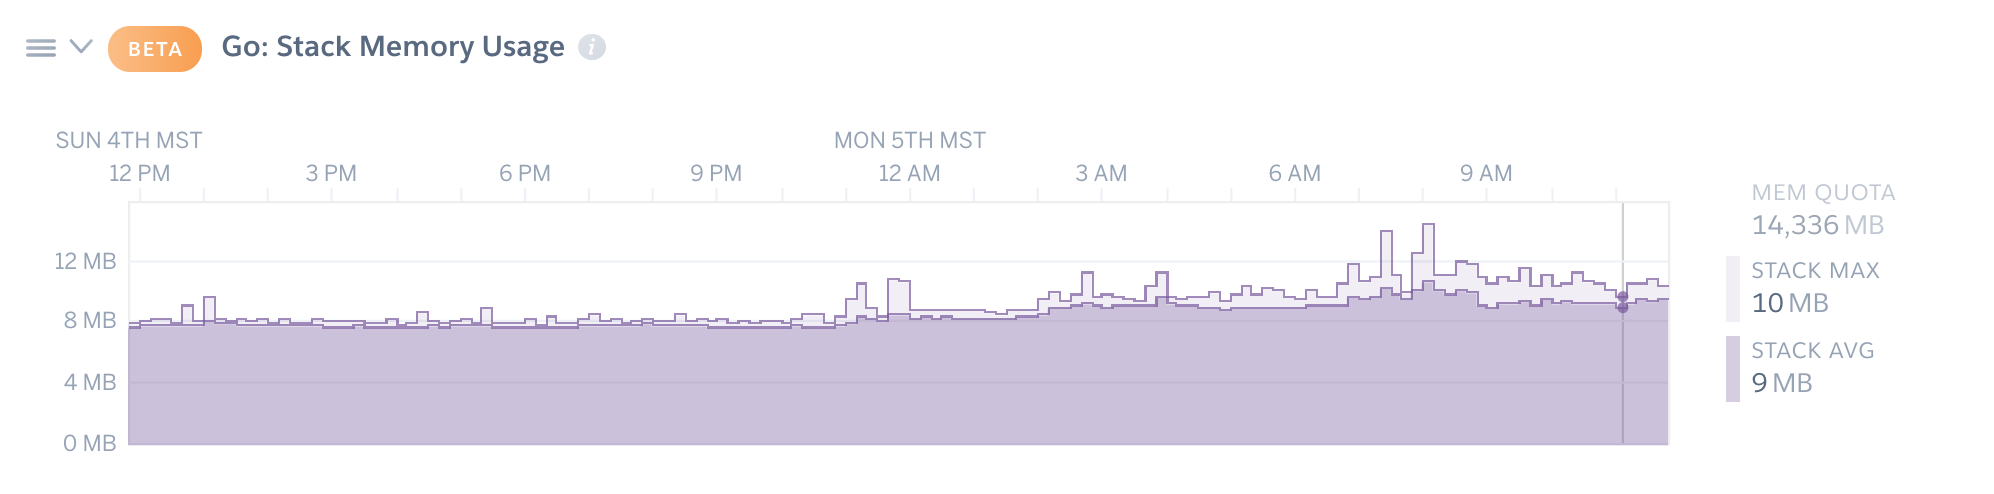
In the above example, to better view the relative usage of stack memory, the memory quota has been toggled off by clicking on the legend entry.
How to use this chart
Large amounts of stack memory use may or may not be okay, it depends on your application. Each goroutine starts out with a 2Kb stack, which grows over time via complete re-allocation, until the goroutine exits. If this graph generally only increases, along with an increase in goroutine count (see below) your application may have a goroutine leak. If you feel you have an issue and have access to heroku exec use tools like gops and it’s pprof support to help diagnose.
Aggregate Stop the World GC Time
This chart plots the total garbage collector (GC) stop-the-world time (runtime.Memstats’ PauseTotalNs derivative) across all dynos of the currently selected process type. Additionally, the legend shows the percentage of the time spent in GC stop-the-world for each aggregated time period.
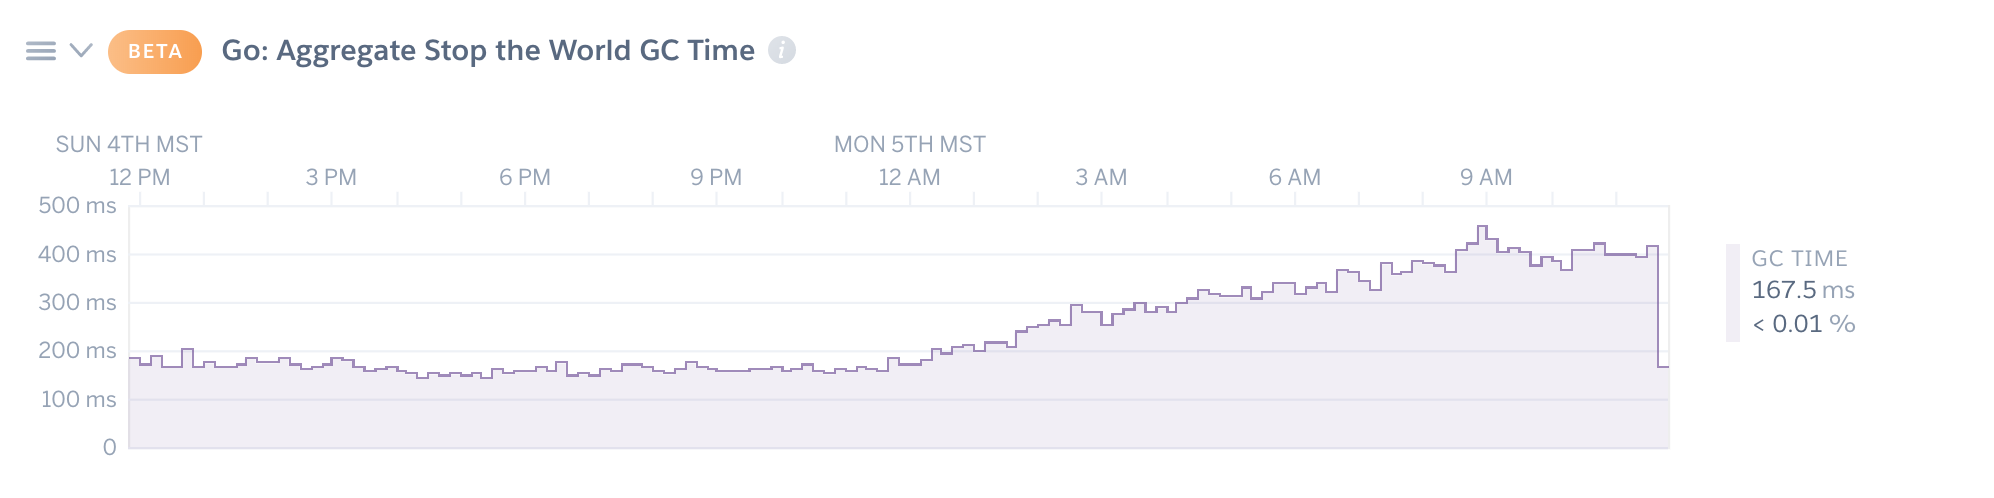
How to use this chart
Go’s GC stop-the-world time should always be pretty low, as most GC work is done in parallel with other goroutines, requiring only short pauses at the start and end of the GC runs. If the percentage of GC stop-the-world time is high and you have access to heroku exec use tools like gops and it’s pprof support to help diagnose.
Aggregate Garbage Collections
This chart plots the aggregate number of GC collections (runtime.Memstats’ NumGC derivative), across all dynos of the currently selected process type.
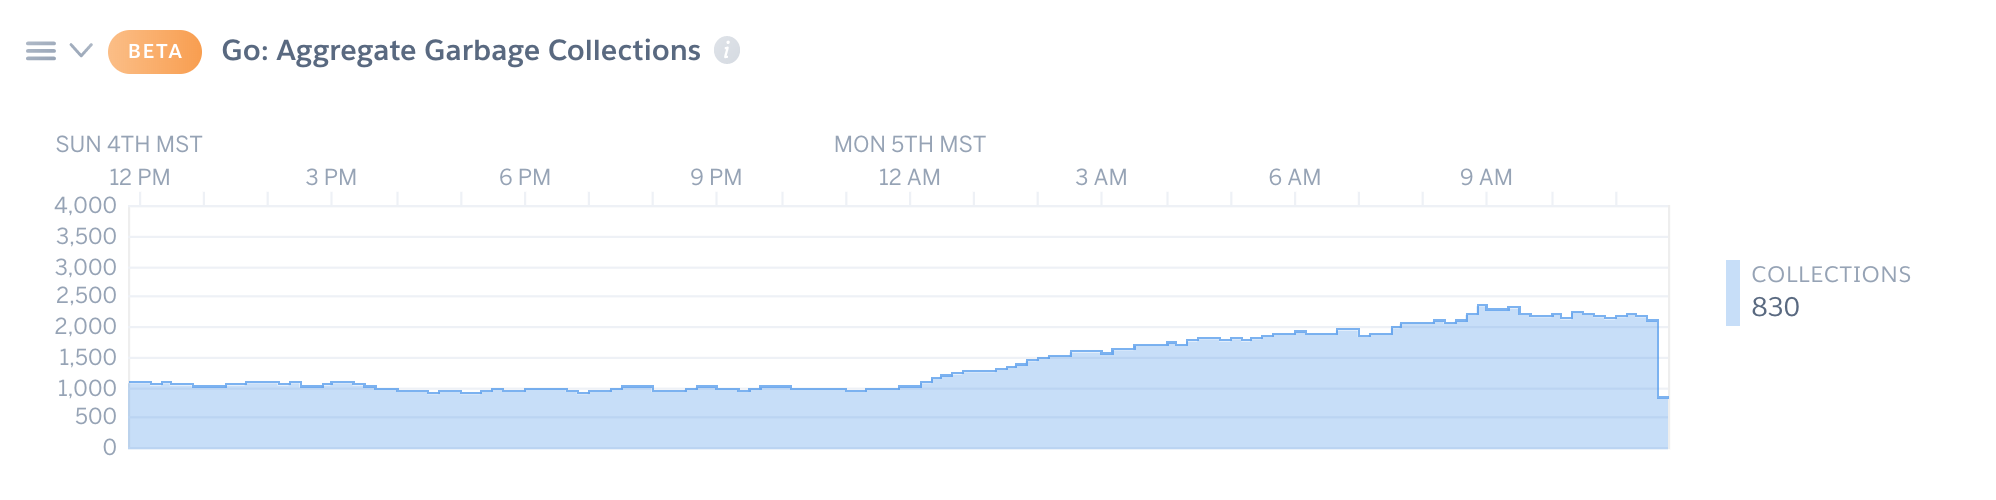
How to use this chart
A high number of garbage collections may indicate a lot of churn in objects on the heap. Setting GODEBUG=gctrace=1 for your application and watching the applications log stream, as well as using tools like gops and it’s pprof support can help diagnose your application if you believe you have an issue.
Heap Objects
This chart plots the minimum, maximum, and average number of heap objects (runtime.Memstats’ Mallocs minus Frees) across all dynos of the currently selected process type.
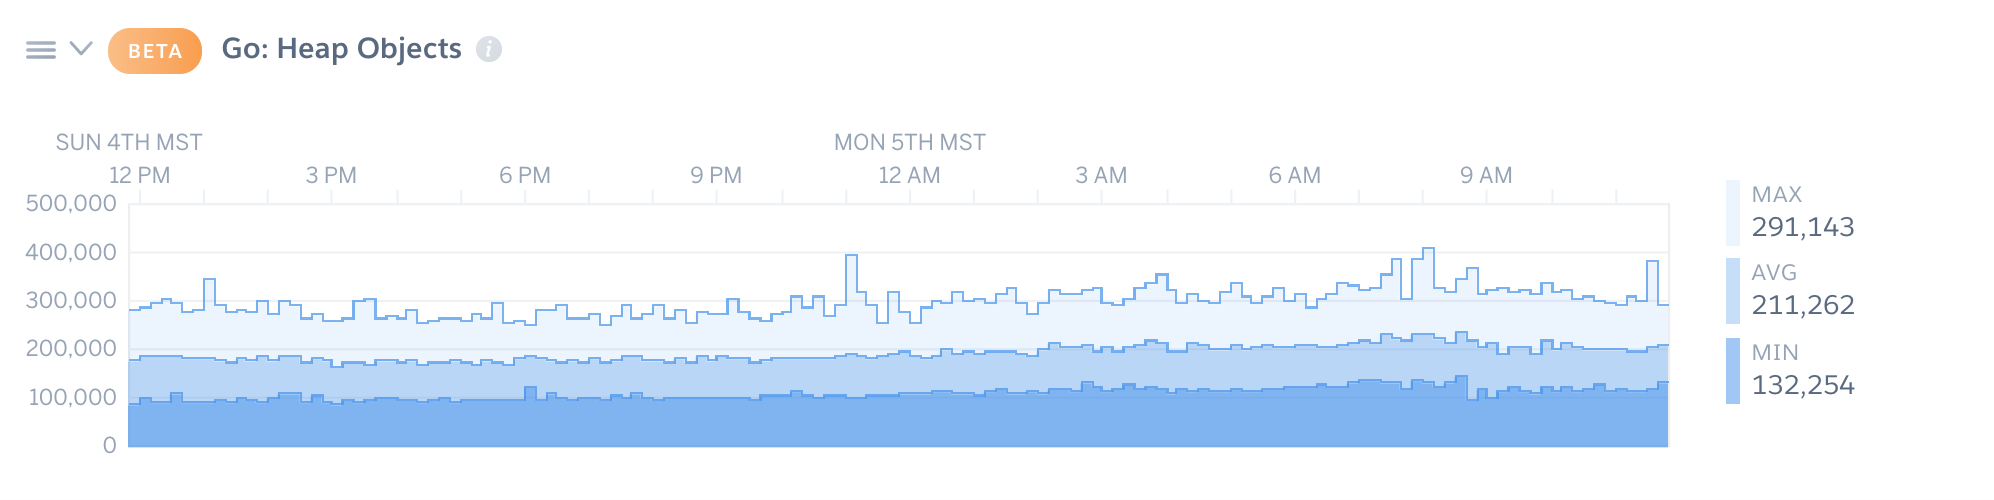
How to use this chart
A large difference between maximum/average/minimum values may indicate a lot of churn in heap objects. See the advice under the Aggregate Garbage Collections Chart
Number of Goroutines
This chart plots the minimum, maximum, and average number of goroutines (runtime.NumGoroutine() ) across all dynos of the current process type.
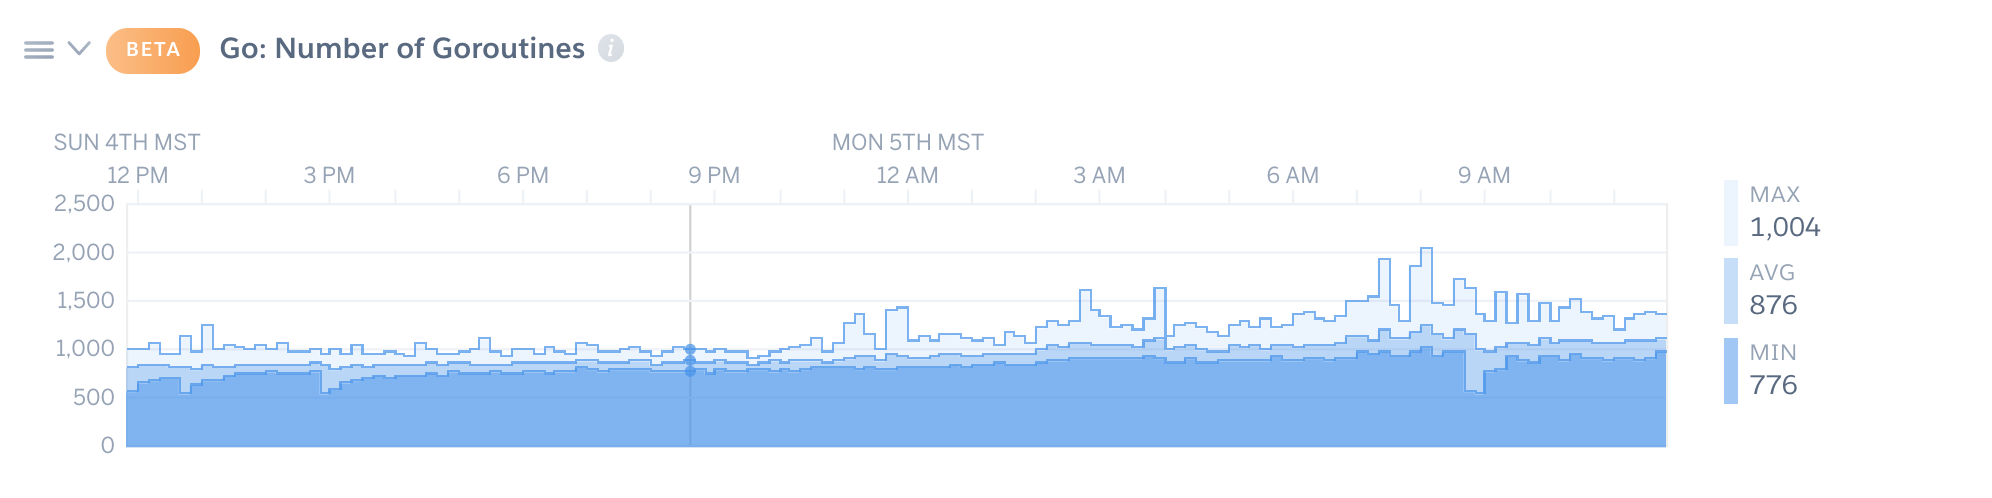
How to use this chart
An ever increasing number of goroutines that only resets on restart, especially when correlated to an ever growing amount of stack memory use likely indicates a goroutine leak. Audit your code to make sure that you know and understand how every created goroutine stops. If you have access to heroku exec tools like gops and it’s pprof support may be able to help you diagnose further.
A Note About Metrics
All of the chart’s plots are rendered from aggregated data from all of the dynos of the currently selected process type. Where a “maximum” value is displayed it is the maximum value, for a given period across all dynos of the selected process type. Similarly, an “average” is an average for a given period across all dynos of the select process type. And a “count” is the sum of all counts for all dynos of the selected process type for a given period. For example: If an application’s “web” process type has 3 dynos, with the following measurements for a given period: web.1 (Heap Memory: 10Kb; # of Goroutines: 10; GC Goal of 8Kb); web.2 (Heap Memory: 8Kb; # of Goroutines: 5; GC Goal of 6Kb); & web.3 (Heap Memory: 15Kb; # of Goroutines: 20; GC Goal of 8Kb). The summary values displayed on the charts for the timeframe would be: Heap Max: 15Kb, Heap Avg: 11 Kb; # of Goroutines: 35; GC Goal Max: 8Kb; GC Goal Avg: 7.3Kb
Disabling Metrics Collection
To disable Go metrics collection, simply toggle off the Enhanced Language Metrics toggle via the Metrics Preferences panel, or by using this CLI command:
$ heroku labs:disable "runtime-heroku-metrics" -a "my-app-name"