Table of Contents [expand]
Last updated September 04, 2025
To provide more visibility into the Node.js runtime, the Node.js language metrics feature surfaces additional language-specific time series metrics within Application Metrics. Node.js metrics include Aggregate Time Spent in Garbage Collection, Aggregate Garbage Collections, Event Loop Latency, and Event Loop Usage.
This feature is currently in public beta.
Node.js language metrics are available for all dynos except for eco dynos.
General Information
For general information on metrics display settings, please refer to the language runtime metrics parent document.
Getting Started
First, enable the Language Metrics flag on your application. You can do this via the Dashboard or the CLI. To enable it through Dashboard, open the metrics preferences panel and turn on the both the Enhanced Language Metrics toggle and the Node Language Metrics toggle.
Alternatively, to enable it through the Heroku CLI:
$ heroku labs:enable "runtime-heroku-metrics" -a "example-app"
$ heroku labs:enable "nodejs-language-metrics" -a "example-app"
Redeploy
Once you have enabled the Enhanced Language Metrics feature re-deploy your application using an empty commit.
$ git commit --allow-empty -m "Enable Node.js Language Metrics"
$ git push heroku master
After a few minutes, you will begin receiving metrics which can be viewed via the Application Metrics tab.
Available Metrics
It may take a few minutes for these metrics to become available after the steps above are completed.
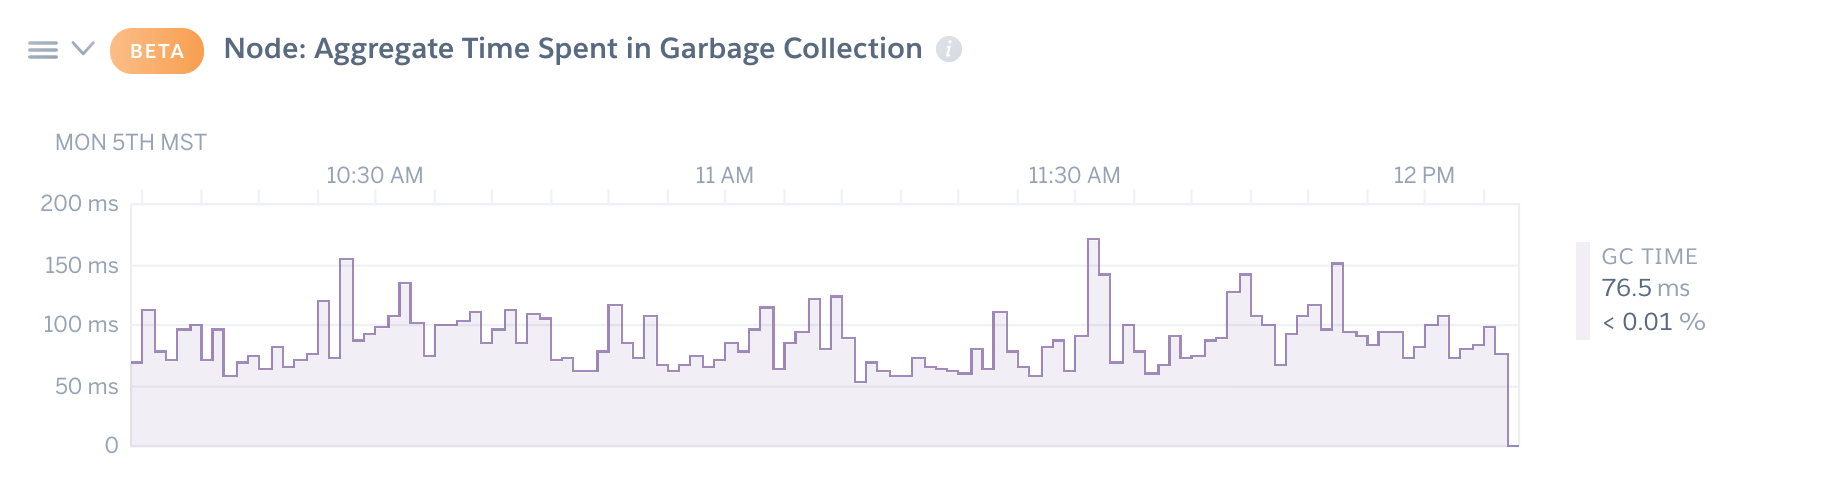
Aggregate Time Spent in Garbage Collection
This plot tracks the total pause time (when app execution is halted) to run garbage collection for each rollup across all dynos of the current process type. It also displays the percentage of the time during the rollup that was spent running the garbage collector.
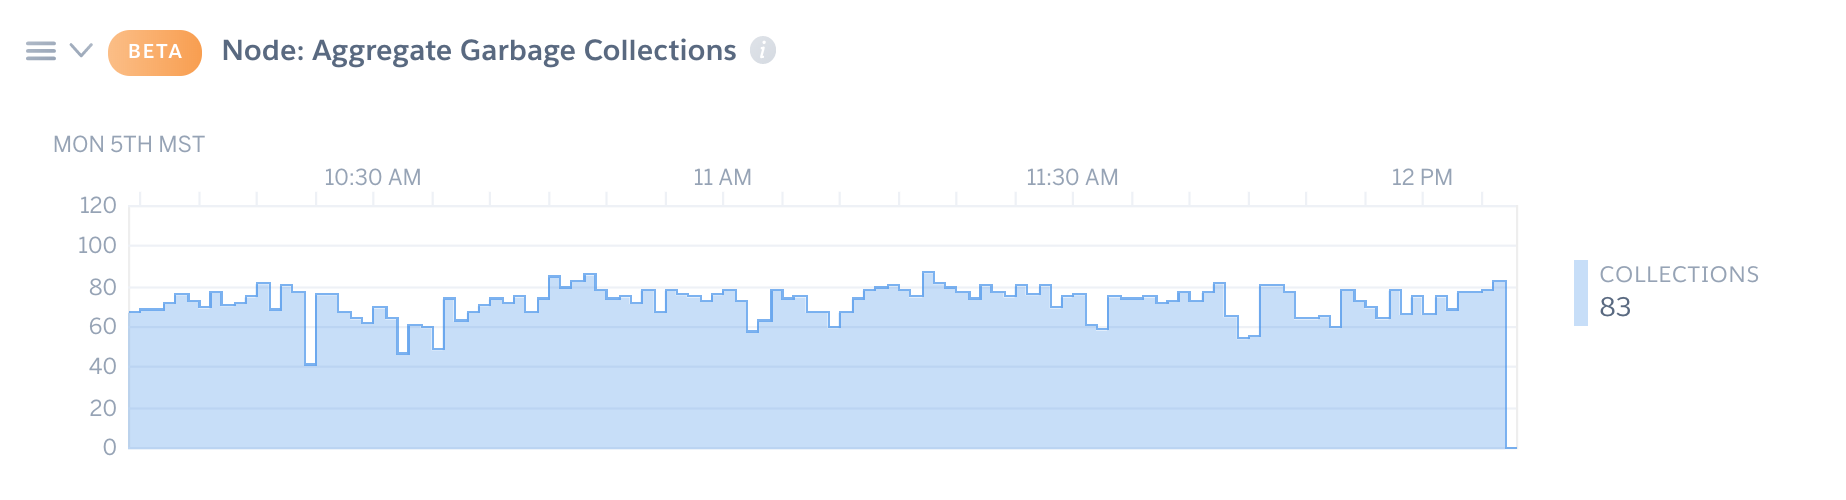
Aggregate Garbage Collections
The number of GC collection, aggregated across all dynos, is displayed on this plot.
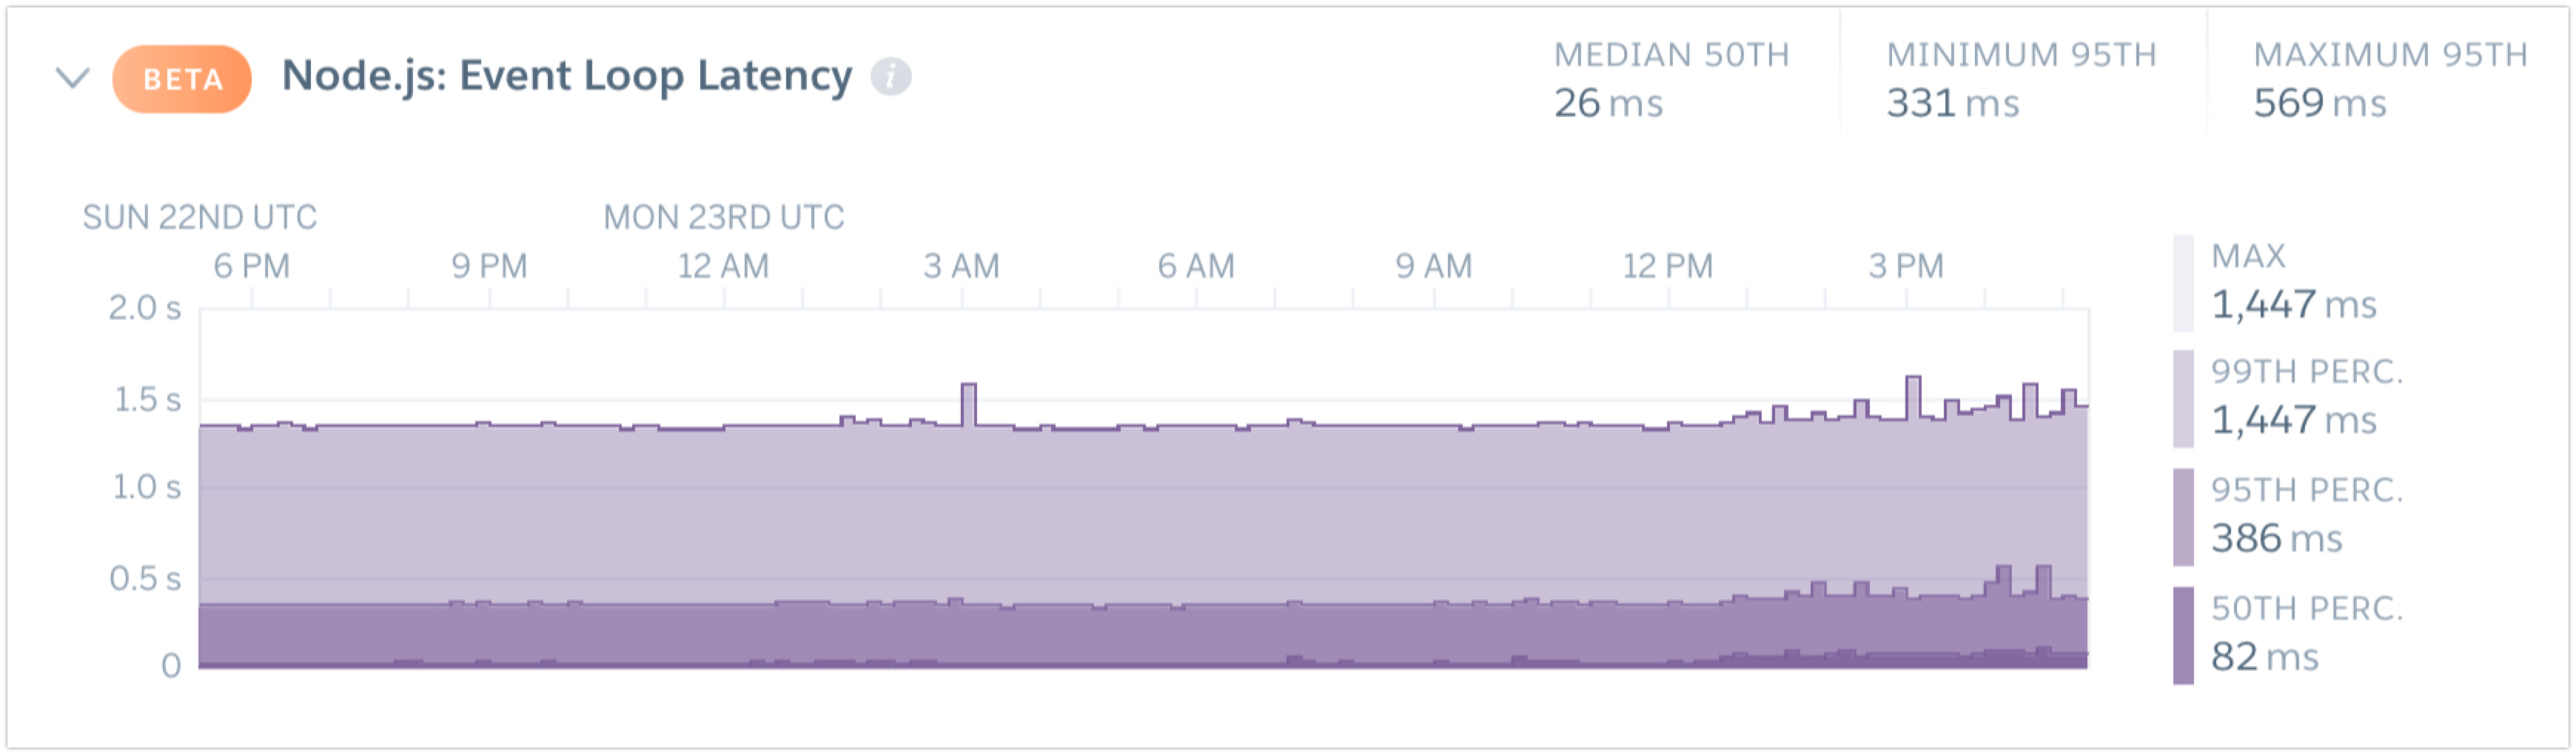
Event Loop Latency
At the heart of Node’s asynchronous model is the Event Loop. Your Node.js app is single-threaded and can only process one request at a time, but when it makes an asynchronous request, like a database query, it yields the thread back to the event loop. Event Loop Latency refers to the amount of time your code runs before yielding back to the event loop. High event loop latency can make it difficult to scale your application as traffic grows.
The latency of the event loop, aggregated across all dynos, and displayed as a median, 95th percentile, 99th percentile, and maximum latency, is displayed on this plot.
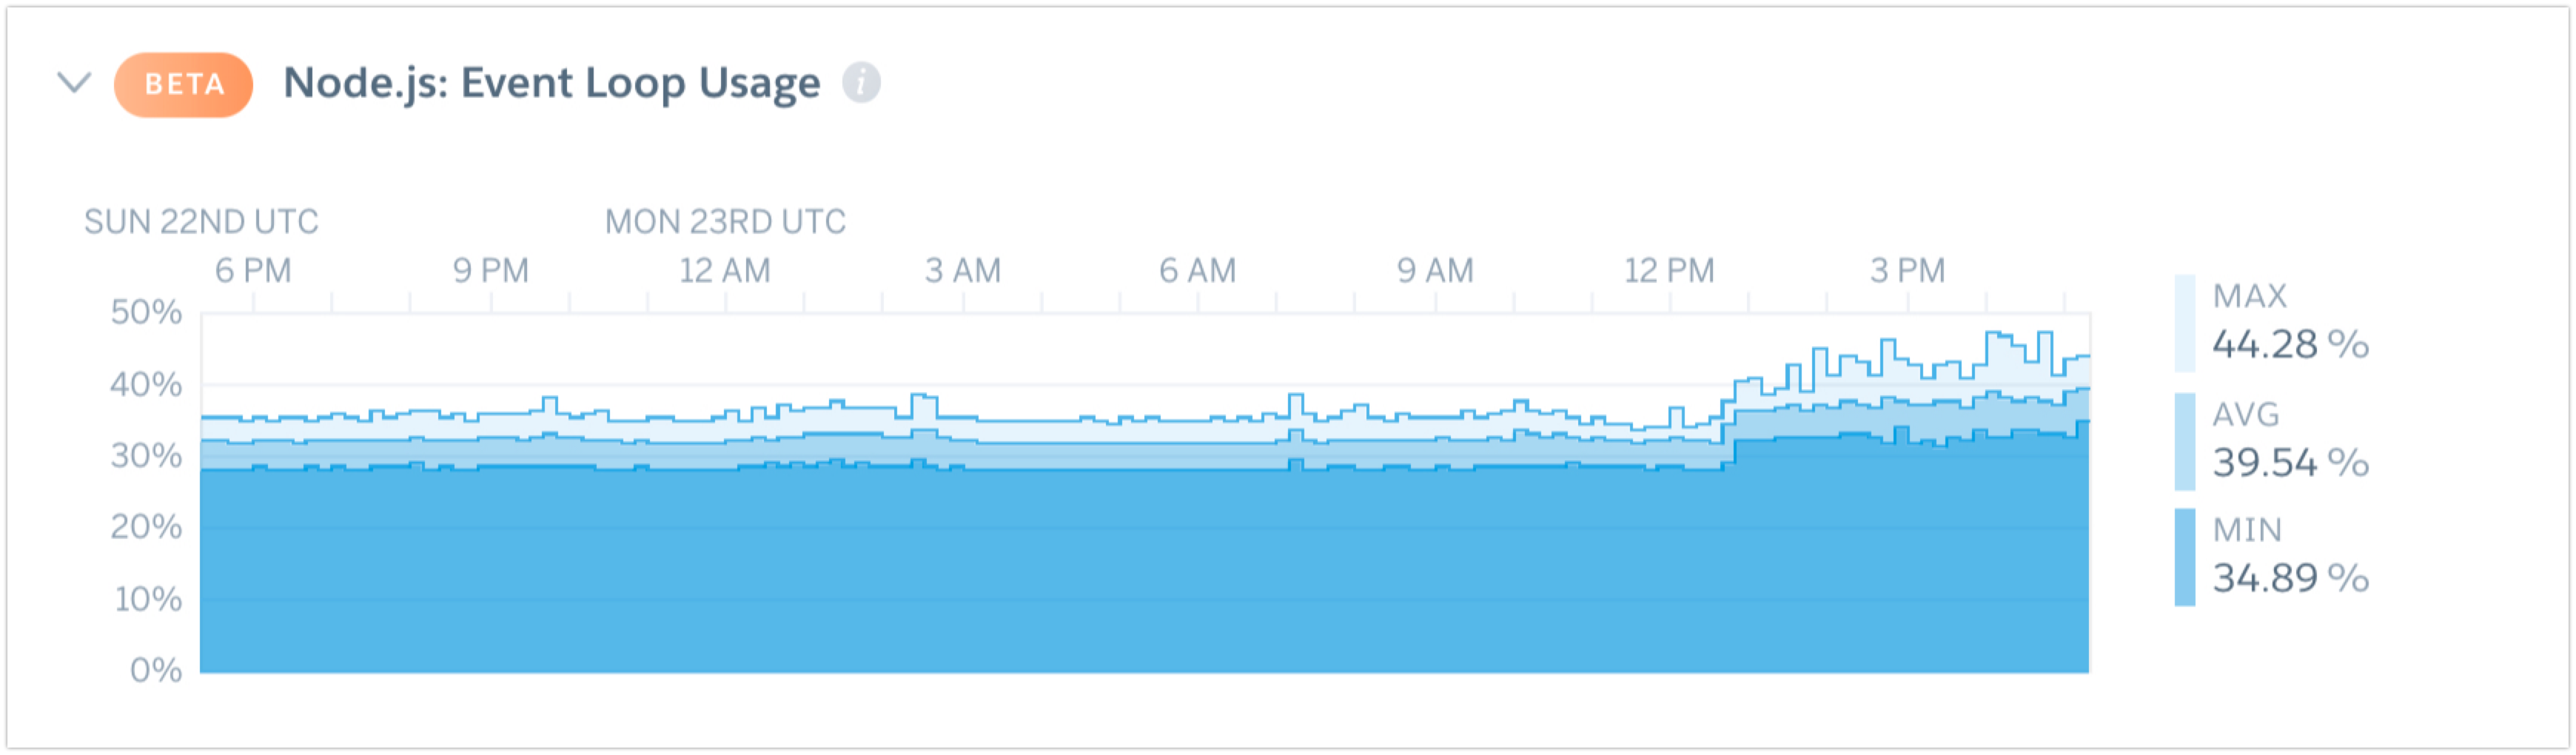
Event Loop Usage
The percentage of time that the event loop is being blocked by work. A high percentage could indicate that your app is under a high load and may be under-provisioned.
The Event Loop Usage plot displays the minimum, maximum, and average of the observations taken during each rollup across all dynos of the current process type regarding the percentage usage of the event loop.
Disabling Metrics Collection
To disable Node.js metrics collection, simply toggle off the Enhanced Language Metrics toggle via the Metrics Preferences panel, or using this CLI command:
$ heroku labs:disable "runtime-heroku-metrics" -a "example-app"