Last updated April 01, 2025
Application-level metrics help developers investigate and diagnose issues with their applications running on Heroku. To view application metrics, navigate to your app in the Heroku Dashboard and click the Metrics tab.
Application metrics aren’t available for apps using eco dynos. Not all Application Metrics features are available to all dyno types. Distinctions in feature availability are noted where applicable.
The Dyno Load chart has been changed to CPU for Fir-generation apps. Restart events and some Heroku error codes are not yet available for Fir apps. Subscribe to our changelog to stay informed of observability-related changes for Fir.
General Settings
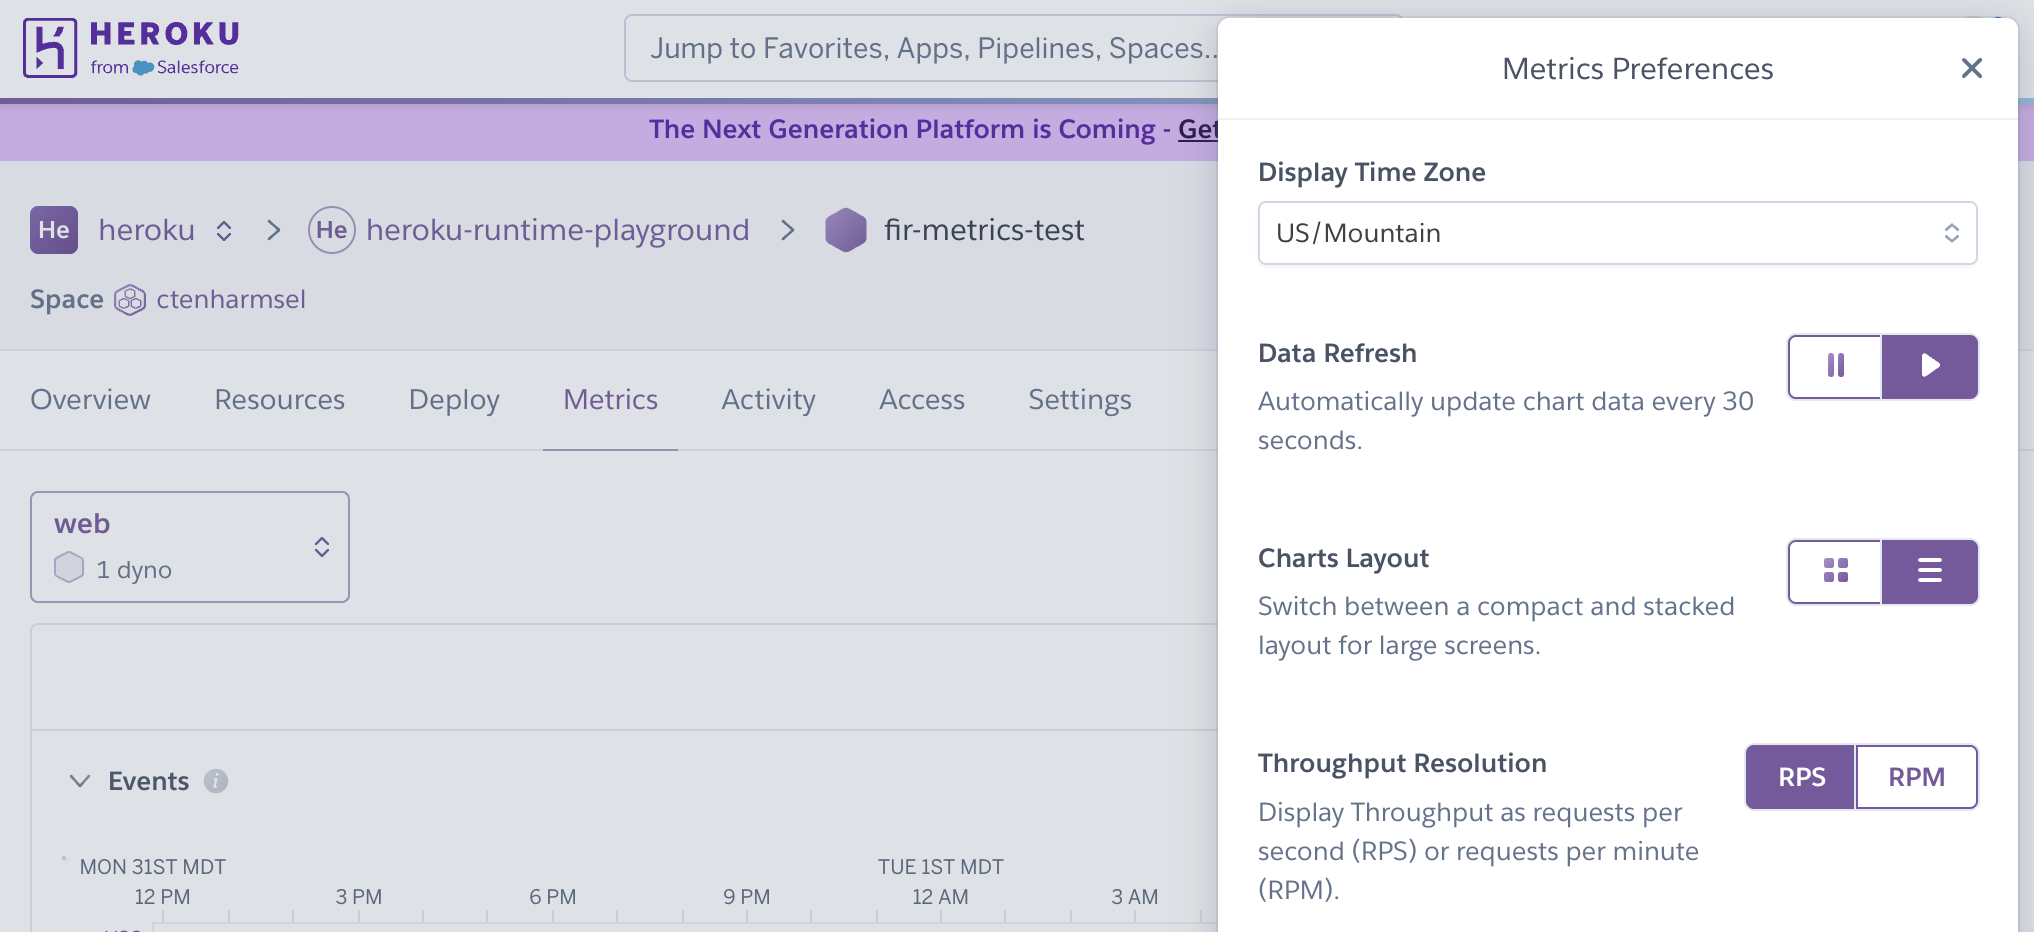
The Application Metrics configuration menu accesses the timezone selector, and chart layout (compact or full) and data refresh and data lag (on/off) settings.
Display of language-specific metrics are not yet available for Fir-generation apps.
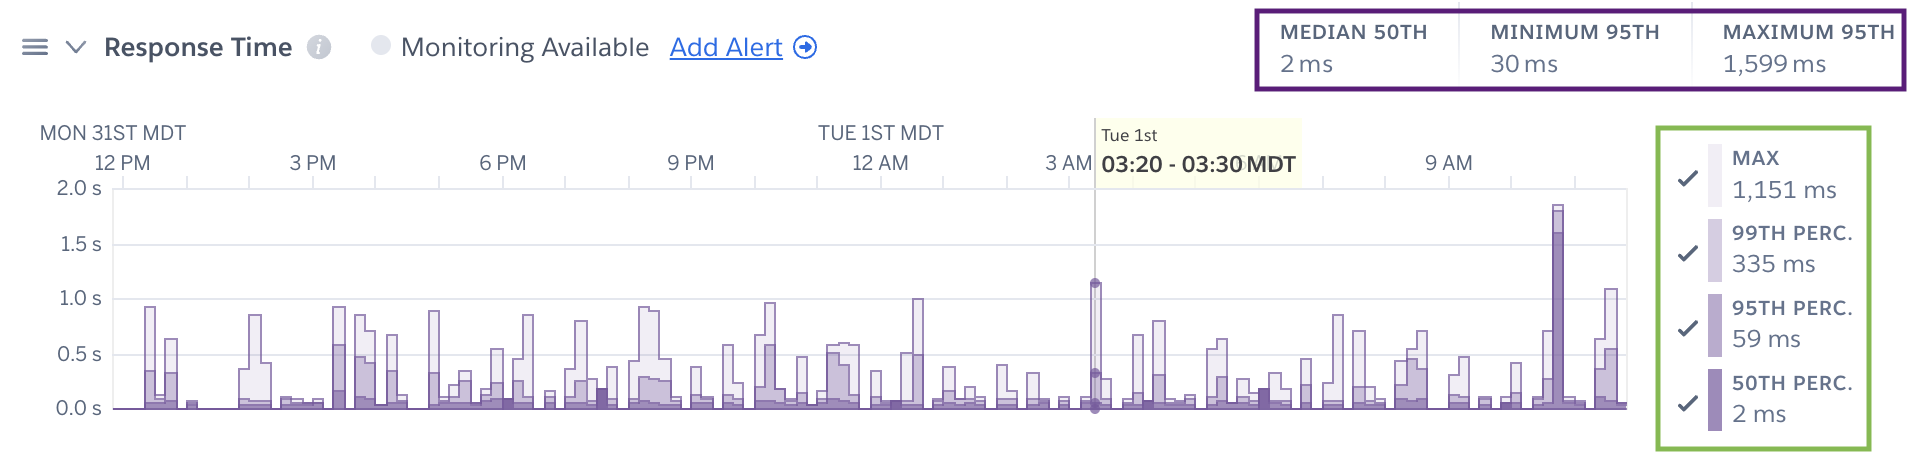
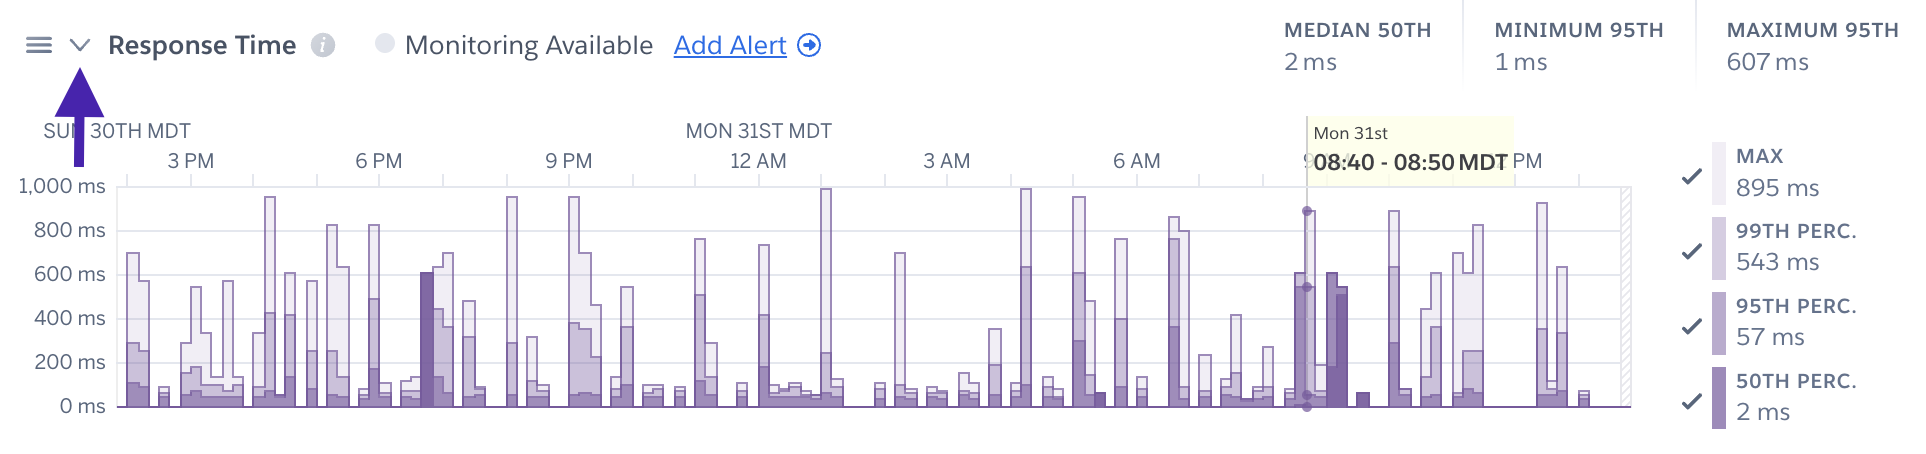
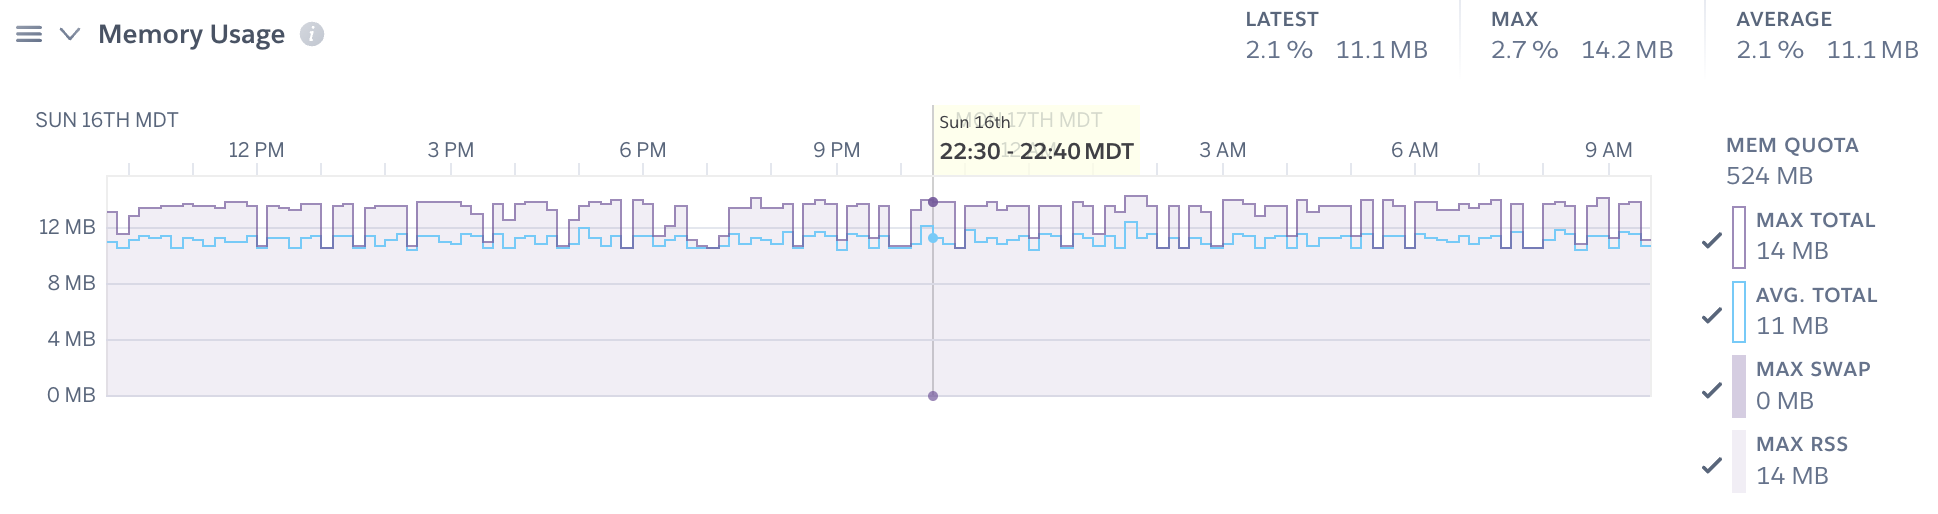
By default the legend displays the latest metrics; however, hovering over a time point on a plot will provide you with the metrics for that time point (green box below). Summary metrics represent the timeframe selected unless otherwise stated (purple box below).
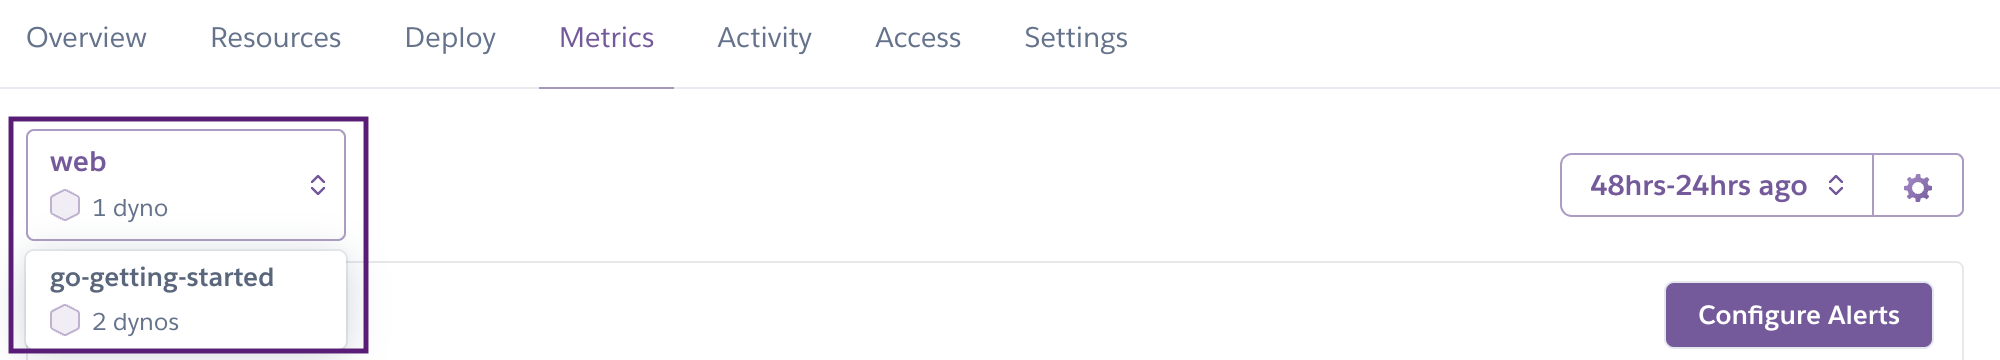
Individual metrics are gathered per process type. You can change the process type you are looking at using the process type selector in the top left corner of the page.
Data Resolution
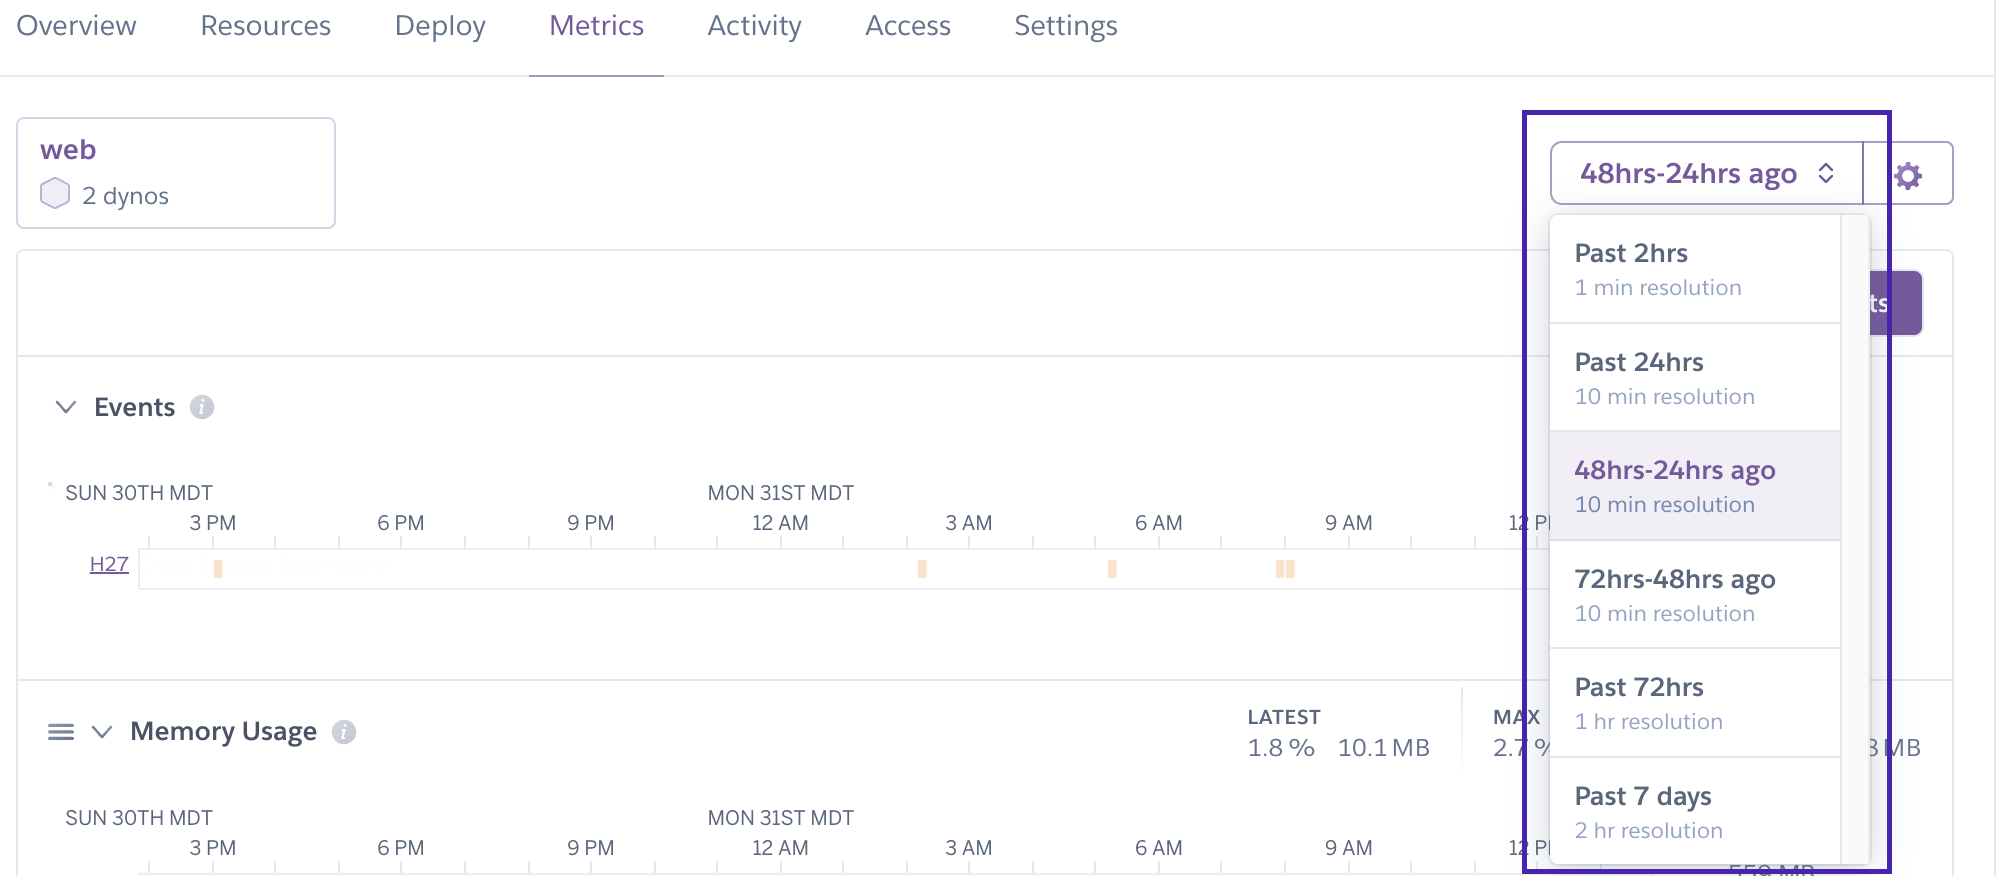
There are 4 levels of data resolution in Application Metrics:
- 1 minute (Past 2hrs)
- 10 minutes (72-48hrs ago, 48-24hrs ago, and Past 24hrs)
- 1 hour (Past 72hrs)
- 2 hours (Past 7 days)
Values represent rollups of data point for the sampling window. Basic dynos only have access to 24 hours of data at 10 minute resolution. Resource utilization values represent maxima or averages per process type.
Changing which Time Series Plots are Displayed
Individual time series plots may be hidden and unhidden with the “V” icon next to the chart title:
Changing which Metrics are Displayed
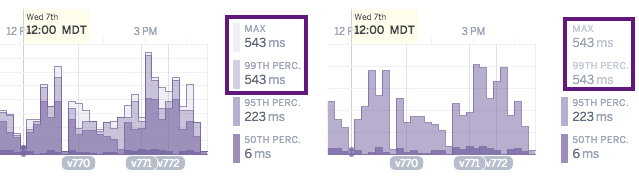
By clicking on the legend entry for an individual metric you can hide and unhide the display of that metric on a plot. The y-axis will rescale to fit the remaining displayed data.
Metrics Gathered for Web Dynos Only
The following metrics are gathered for only the web process type:
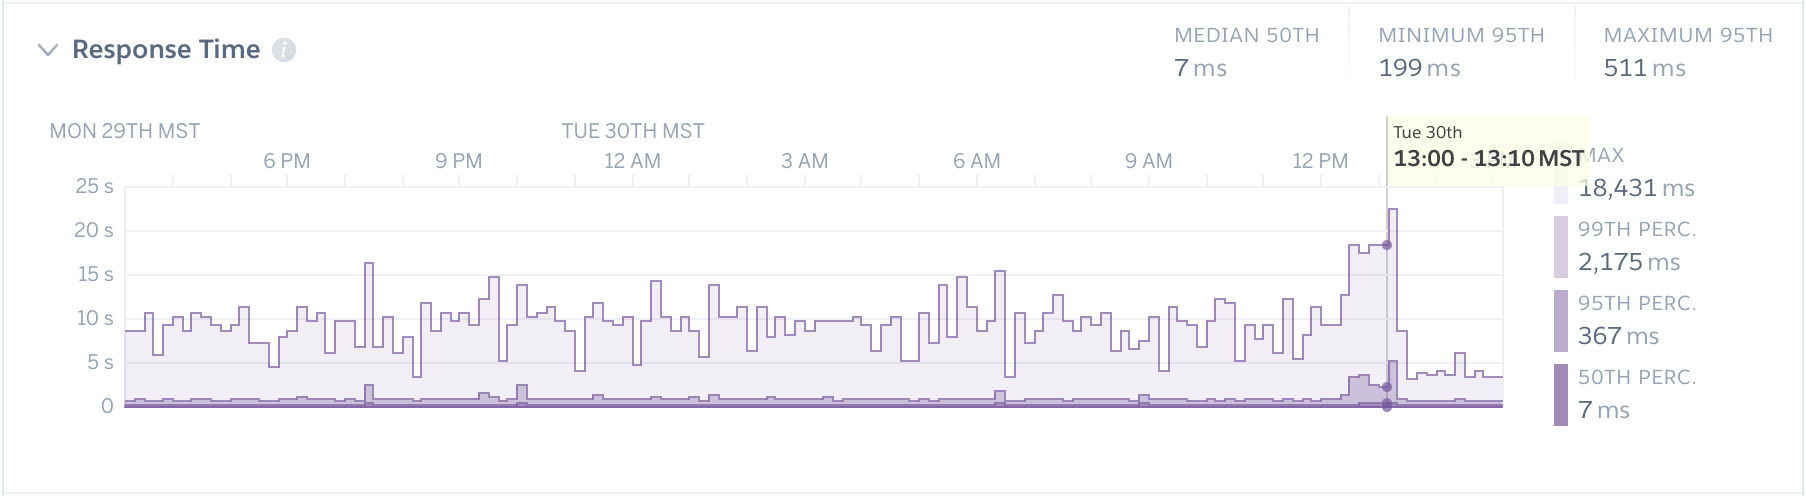
Response Time
- Median: The median response time (50th percentile) of HTTP requests within the specified sampling interval (10 or 1 minute). This means that 50% of an application’s web requests were completed within less time than the median, and 50% were completed within more.
- 95th Percentile: The 95th percentile response time of HTTP requests within the specified sampling interval. This means that 95% of an application’s web requests were completed within less time, and 5% were completed within more. This is helpful for providing an upper bound (but not maximum) for expected response times.
- 99th Percentile: The 99th percentile response time of HTTP requests within the specified sampling interval.
- Max: The max response time of all HTTP requests within the specified sampling interval.
Summary metrics for response time, including the median of the median (50th percentile) response times, and the minimum and maximum 95th percentile, are also displayed for the selected time interval.
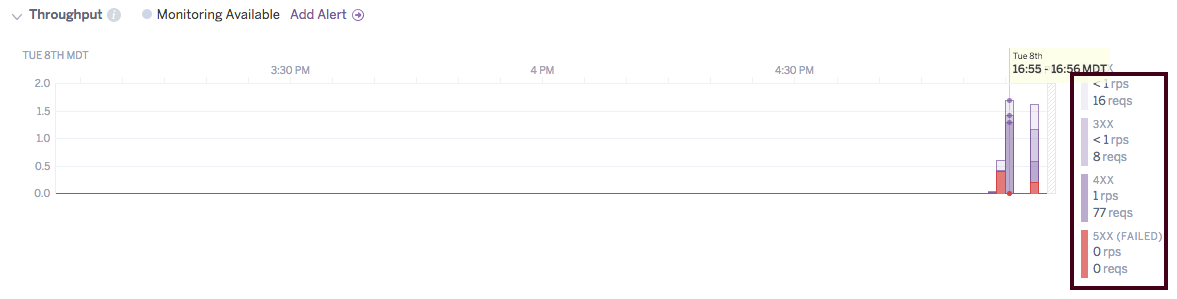
Throughput
The Throughput plot displays the number of requests broken down by HTTP status code (1XX, 2XX, 3XX, 4XX and 5XX). The throughput (which can be toggled between RPS and RPM in the metrics preferences) is also displayed for each status code in the legend. Requests that result in a 5XX status code are considered failed requests.
Metrics gathered for all dynos
The following metrics are gathered for all process types, and are averages of the metrics of the dynos of that process type for a given application:
Memory Usage
Swap memory is not reported for Fir-generation apps, because the metric is not available for the Kubernetes backend.
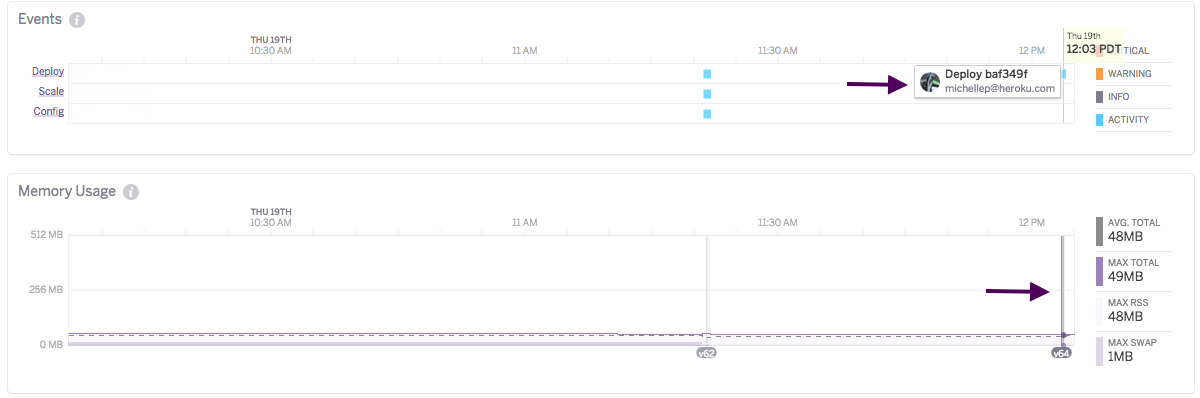
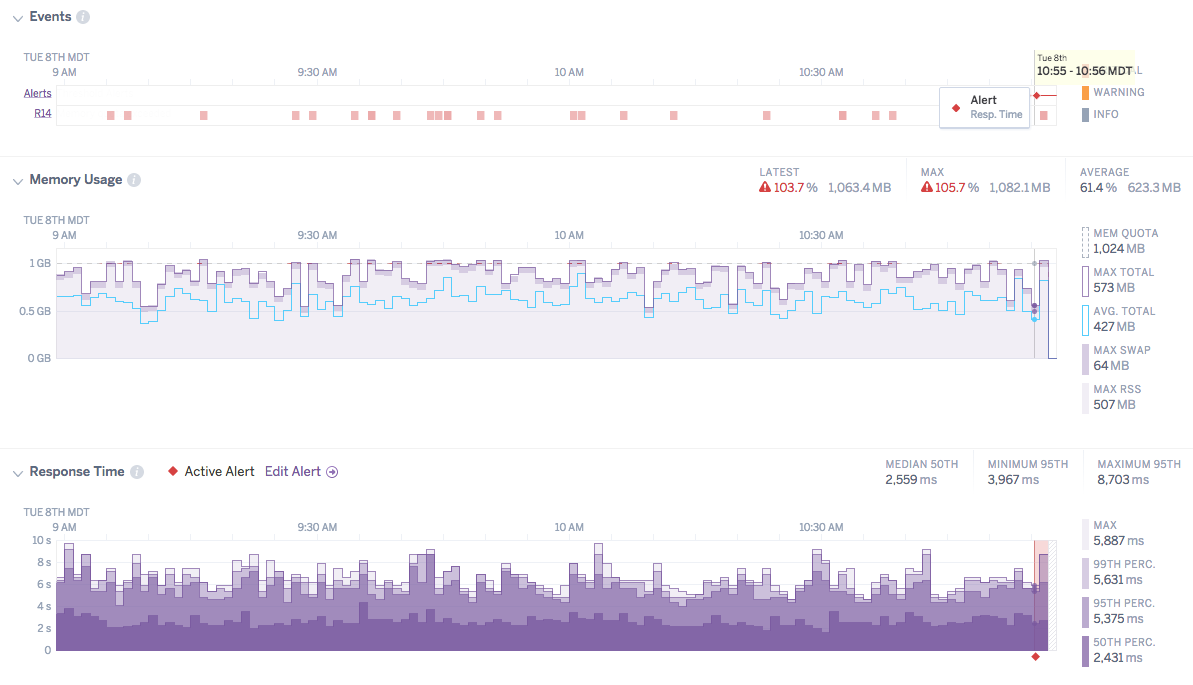
Maximum overall memory usage is displayed as a single stacked plot, combining maximum rss and maximum swap memory as reported for 10 or 1 minute increments. Mean total memory (rss + swap) is displayed as a blue line. Memory quota is depicted as a dashed gray line with any quota breaches flagged in red. The latest, mean, and max percent memory are shown for the selected time interval (e.g. 24 hours), along with the raw value.
- Memory Quota: The maximum amount of RAM available to your selected dyno type, above which an R14 memory error would be triggered.
- Total Memory: Mean total memory represents the portion of memory which users can optimize and is shown as the sum of rss and swap as measured in 10 or 1 minute increments and averaged across all dynos.
- RSS: The amount of memory (megabytes) held in RAM across dynos of a given process type. Max RSS is reported for each 10 or 1 minute interval.
- Swap: The portion of a dyno’s memory, in megabytes, stored on disk. It’s normal for an app to use a few megabytes of swap per dyno. Higher levels of swap usage though may indicate too much memory usage when compared to the dyno size. This can lead to slow response times and should be avoided. Max swap is reported for each 10 or 1 minute interval.
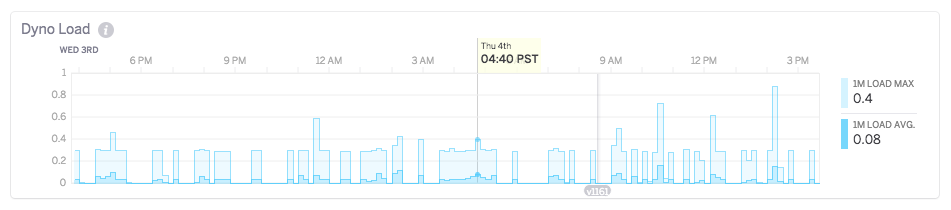
Dyno Load
Cedar-Generation Apps
The load value for Cedar-generation apps indicates a runnable task (a process or thread) that is either currently running on a CPU or is waiting for a CPU to run on, but otherwise has all the resources it needs to run. The load value does not include tasks that are waiting on IO. For example:
If your application has four physical cores and is executing four concurrent threads, the load value will show 4. As the value goes above the number of physical cores on the system, this indicates that there is contention for one or more physical cores.
If your application has two concurrent threads waiting on a database result and three concurrent threads executing CPU bound tasks, the load value will indicate three.
- 1m Load Average: For 10-minute sampling intervals the mean of the 1 minute load average for each 10 minute period is shown. For 1-minute windows, the 1-minute load average is directly displayed. The load average reflects the number of CPU tasks expressed as an exponentially dampened average over the past 30 minutes.
- 1m Load Max: For 10-minute windows this is the maximum value of the 1 minute load average for the time period. For 1 minute intervals, the maximum load average from 20-second sampling intervals is displayed.
CPU Usage
For Fir-generation apps, Heroku displays the CPU usage instead of the load average. The following CPU usage metrics are included in the plot:
- Max Usage: The max usage is the maximum CPU usage value as identified for the selected resolution rollups and timeframe.
- Average Usage: The average usage is the average CPU usage as calculated across the selected resolution rollups and timeframe.

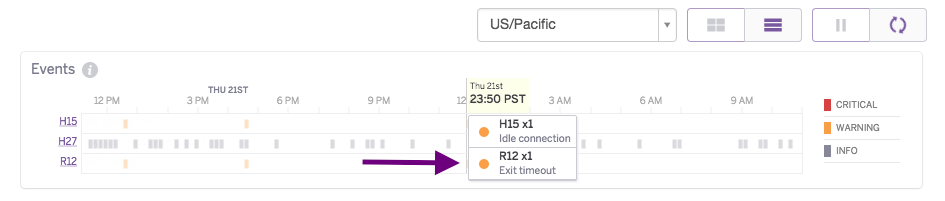
Events
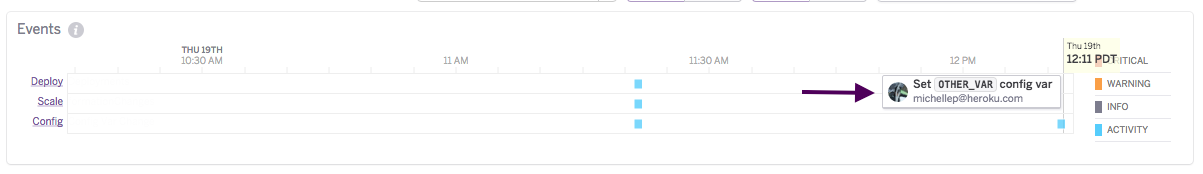
The Events table contains Heroku errors and user-initiated events that influence application health. Currently tracked user activities include deployments, configuration changes, and restarts. Activity events (such as deployments and configuration changes) are displayed in blue. Color gradients indicate the relative number of events of each type that occurred during each time interval since at most only one marker of the event type is displayed per time interval. Additional details are available by hovering over the specific event. These details include error descriptions, and for user-initiated events who made the change and what happened.
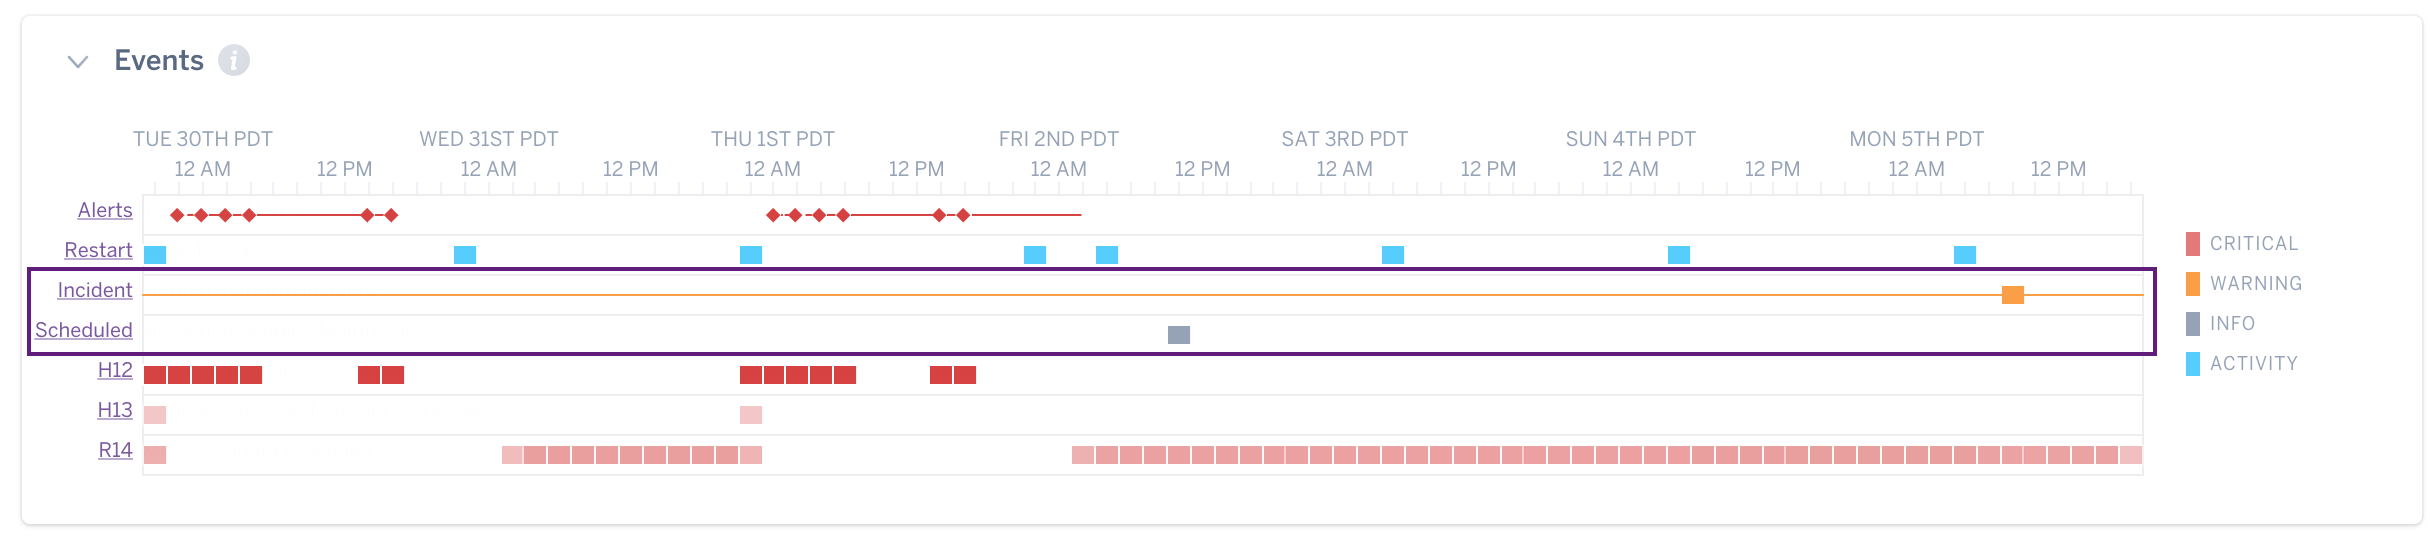
Errors
Some error codes are not yet available for Fir-generation apps.
Critical errors are displayed in red, warning level errors in orange, and informational errors in gray.
Platform Status Events
Two types of platform status events are shown: incidents (yellow) and scheduled maintenance (gray). You will only see the events applicable to your region.
Configuration Variable Change Events
Changes to configuration variables are also captured as events, with the variable that changed shown in the event details.
Deployment Events and Markers
Deploys are also displayed in the Events chart. Deployment activities are extended onto the Metrics plots as deployment markers to help users visualize the impact of deployments on application health.
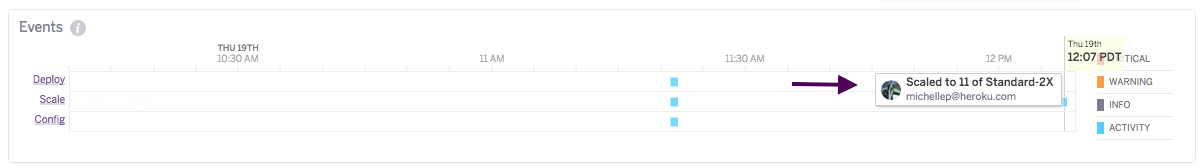
Scaling Events
Scaling events represent horizontal and/or vertical dyno scaling activities.
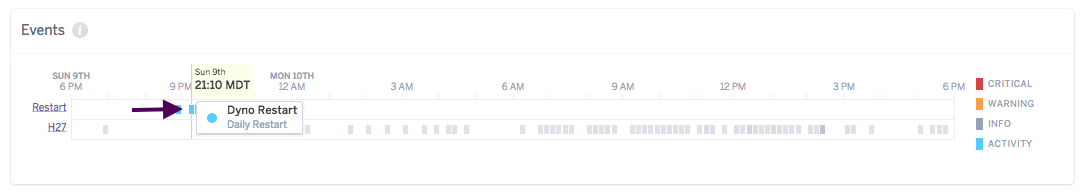
Restart Events
Restart events are not yet available for Fir-generation apps.
There are three categories of restart events displayed on the Events chart:
- user initiated, including manual restarts and restarts associated with deployments, configuration changes, and dyno type changes
- platform initiated, daily scheduled dyno restart (shown as daily restarts in the logs)
- platform initiated restarts after unexpected runtime crashes (shown as relocations in the logs)
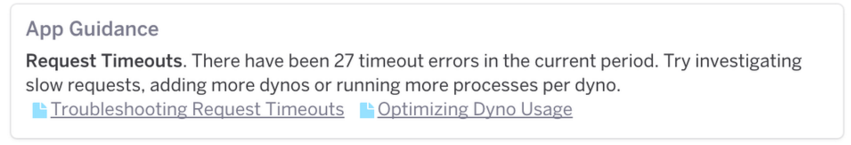
Application Guidance
In addition to raw metrics, Heroku provides online notifications of specific conditions that might be indicative of problems with your application. Links to relevant Dev Center articles are included to provide recommendations on how to correct the problem. Language-specific guidance is provided where available. The list of alerts provided is constantly evolving as we gather more data about application behavior, but examples include alerts on memory errors, request timeouts, and slow response times.
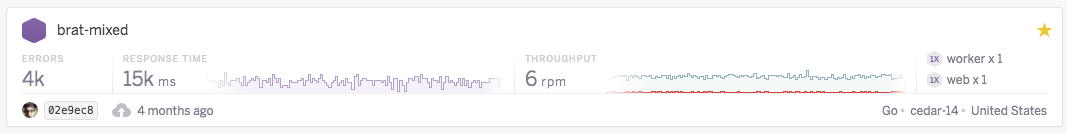
Metrics for App Favorites
24 hour summary web metrics and sparklines are also displayed for each favorited app in the default Heroku Dashboard view. Summary metrics include the total number of dyno and router errors, and the most recent 95th percentile response time and throughput value based on 10 min resolution. Only apps with web dynos will be displayed. Other basic information about your app, including dyno formation/location, most recent deployment, and language, is also shown.
Threshold Alerting
The Threshold Alerting feature is available to apps running on Professional dynos (standard-1x, standard-2x and performance) and all Fir dynos. It allows you to specify limits on web dyno 95th percentile response time and the percentage of failed requests (requests that return a 5XX status code) above which an alert will be triggered. Email, PagerDuty, and dashboard notifications are supported.
To set up an alert select Configure Alerts to open the Alert Setup dialog.
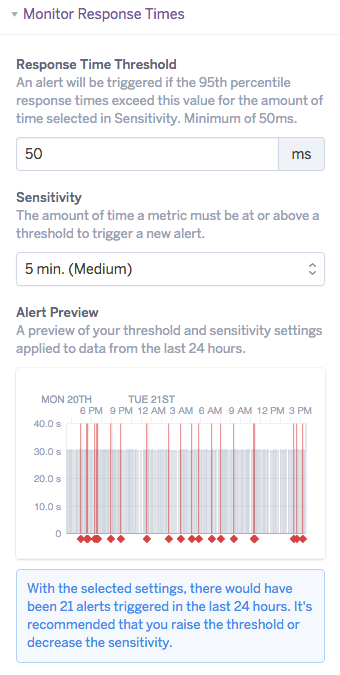
Alert Configuration
Select the metric(s) that you wish to monitor, “Response Time” and/or “Failed Responses”. Adjust the threshold and sensitivity as appropriate. Note that for response time the minimum threshold is 50ms. The sensitivity is the duration an error state must occur prior to triggering an alert. The Alert Simulation shows you how many alerts would have been triggered in the past 24 hours for the app with the selected settings.
A summary of alert configuration and state will appear below the corresponding metrics plot, with the option to edit the existing setup.
PagerDuty and Additional Email Configuration (optional)
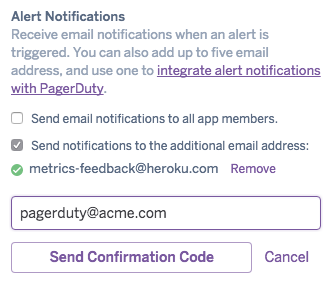
By default the distribution for email notifications is all app owners and collaborators for non-org accounts, and admins for those in a Heroku Enterprise org. For email-based PagerDuty integration first create a new PagerDuty service (or use an existing one) with your preferred escalation policies following PagerDuty’s instructions. Enter the email address you’ll be using; this is the email address PagerDuty will use to create incidents and the email address Heroku will use for email notifications.
The following steps are the same for both PagerDuty integration and additional email setup. Select Add Email for Alert Notifications and enter the PagerDuty or additional email. A code will be sent to PagerDuty Incidents or additional email, respectively, for confirmation. Enter this code in the Alerting Setup to continue. Up to five additional emails are supported per alert monitor.
The mail platform has a daily limit of 5 email additions per user, so if you are adding additional emails across multiple monitors it is possible you may hit your daily limit before you hit the max per alert monitor limit. Even though we support multiple addresses, the preferred approach is to use your email platform to create an alias and manage group membership outside of the alert notification framework.
Notification Delivery
Specify whether you would like to receive email notifications (default or PagerDuty/additional), and if so, the notification frequency for active alerts. Leaving both boxes unchecked results in silent (dashboard only) notifications.
Alert Activation
Lastly, activate the alert and select Confirm.
Alert Notifications
Dashboard alert notifications appear in multiple locations in the Heroku dashboard, including:
- the Metrics Events table
- the corresponding Metrics plot
- the apps list
- Pipelines
- app headers
The icon for an actively alerting app is denoted with a red diamond symbol.
With email notifications an initial email is sent once an alert is triggered. For active alerts emails will be sent at the frequency specified in your delivery preferences. A final alert notification is sent when the error state is resolved.
Access
For those using Heroku Enterprise Teams the operate permission is required to configure and view alerts in Application Metrics.