Skip Navigation
Show nav
Dev Center
  • Get Started
  • Documentation
  • Changelog
  • Search
  • Get Started
    • Node.js
    • Ruby on Rails
    • Ruby
    • Python
    • Java
    • PHP
    • Go
    • Scala
    • Clojure
    • .NET
  • Documentation
  • Changelog
  • More
    Additional Resources
    • Home
    • Elements
    • Products
    • Pricing
    • Careers
    • Help
    • Status
    • Events
    • Podcasts
    • Compliance Center
    Heroku Blog

    Heroku Blog

    Find out what's new with Heroku on our blog.

    Visit Blog
  • Log inorSign up
Hide categories

Categories

  • Heroku Architecture
    • Compute (Dynos)
      • Dyno Management
      • Dyno Concepts
      • Dyno Behavior
      • Dyno Reference
      • Dyno Troubleshooting
    • Stacks (operating system images)
    • Networking & DNS
    • Platform Policies
    • Platform Principles
  • Developer Tools
    • Command Line
    • Heroku VS Code Extension
  • Deployment
    • Deploying with Git
    • Deploying with Docker
    • Deployment Integrations
  • Continuous Delivery & Integration (Heroku Flow)
    • Continuous Integration
  • Language Support
    • Node.js
      • Working with Node.js
      • Node.js Behavior in Heroku
      • Troubleshooting Node.js Apps
    • Ruby
      • Rails Support
      • Working with Bundler
      • Working with Ruby
      • Ruby Behavior in Heroku
      • Troubleshooting Ruby Apps
    • Python
      • Working with Python
      • Background Jobs in Python
      • Python Behavior in Heroku
      • Working with Django
    • Java
      • Java Behavior in Heroku
      • Working with Java
      • Working with Maven
      • Working with Spring Boot
      • Troubleshooting Java Apps
    • PHP
      • PHP Behavior in Heroku
      • Working with PHP
    • Go
      • Go Dependency Management
    • Scala
    • Clojure
    • .NET
      • Working with .NET
  • Databases & Data Management
    • Heroku Postgres
      • Postgres Basics
      • Postgres Getting Started
      • Postgres Performance
      • Postgres Data Transfer & Preservation
      • Postgres Availability
      • Postgres Special Topics
      • Migrating to Heroku Postgres
    • Heroku Key-Value Store
    • Apache Kafka on Heroku
    • Other Data Stores
  • AI
    • Model Context Protocol
    • Vector Database
    • Heroku Inference
      • Inference Essentials
      • AI Models
      • Inference API
      • Quick Start Guides
    • Working with AI
  • Monitoring & Metrics
    • Logging
  • App Performance
  • Add-ons
    • All Add-ons
  • Collaboration
  • Security
    • App Security
    • Identities & Authentication
      • Single Sign-on (SSO)
    • Private Spaces
      • Infrastructure Networking
    • Compliance
  • Heroku Enterprise
    • Enterprise Accounts
    • Enterprise Teams
    • Heroku Connect (Salesforce sync)
      • Heroku Connect Administration
      • Heroku Connect Reference
      • Heroku Connect Troubleshooting
  • Patterns & Best Practices
  • Extending Heroku
    • Platform API
    • App Webhooks
    • Heroku Labs
    • Building Add-ons
      • Add-on Development Tasks
      • Add-on APIs
      • Add-on Guidelines & Requirements
    • Building CLI Plugins
    • Developing Buildpacks
    • Dev Center
  • Accounts & Billing
  • Troubleshooting & Support
  • Integrating with Salesforce
  • Monitoring & Metrics
  • Production Check

Production Check

English — 日本語に切り替える

Last updated November 07, 2022

Table of Contents

  • How to check your app
  • Dyno redundancy
  • Heroku Postgres
  • Visibility and monitoring

Production Check tests your app’s configuration against a set of optional—but highly recommended—criteria. It makes it easy to ensure that your app’s configuration lends itself to maximum uptime. Moreover, it ensures that you have tools available for understanding and monitoring the factors that contribute to uptime.

How to check your app

To run Production Check, navigate to your app in the Heroku Dashboard, click the actions menu in the top-right corner, and then click Production check.

Production Check will run a series of tests on your app. These tests are recommended for maintaining and monitoring availability. Each check includes useful links to related resources.

Dyno redundancy

Running at least 2 web dynos for any mission-critical app increases the probability that the app will remain available during a catastrophic event. Multiple dynos are also more likely to run on different physical infrastructure (for example, separate AWS Availability Zones), further increasing redundancy.

Use the heroku ps command to determine how many dynos of each type your app is currently running. Use heroku ps:scale to scale the number of dynos your app is running.

$ heroku ps -a ha-app
=== web:
web.1: up for 17m

$ heroku ps:scale web+2
Scaling web processes... done, now running 3

This applies to web dynos but also any background or worker dynos as well.

Heroku Postgres

Database plan

It’s recommended to use a database on a Standard-tier or higher plan if you require predictable performance and availability. Essential-tier, by design, have variable performance characteristics. For more information, see Choosing the Right Heroku Postgres Plan.

Standard-tier or higher databases achieve the highest expected uptime and include automated health checks, data snapshots, and advanced features such as fork and follow.

$ heroku pg:info -a ha-app
=== HEROKU_POSTGRESQL_CYAN_URL (DATABASE_URL)
Plan:               Standard 0
Status:             Available
Data Size:          6.4 MB
Tables:             0
PG Version:         9.4.1
Connections:        2/120
Fork/Follow:        Available
Rollback:           earliest from 2015-04-24 22:16 UTC
Created:            2015-04-24 22:14 UTC
Maintenance:        not required
Maintenance window: Mondays 20:30 to Tuesdays 00:30 UTC

If your application requires a non-relational data store, Amazon DynamoDB is another great candidate for highly available data storage.

High availability

The Premium, Private and Shield tiers of Heroku Postgres databases have additional benefits for application uptime, including High Availability with automatic failover.

Visibility and monitoring

In order to improve the availability of your app, it helps to have excellent awareness of, and reactivity to, the state of your app. This can be accomplished with a variety of tools.

App monitoring

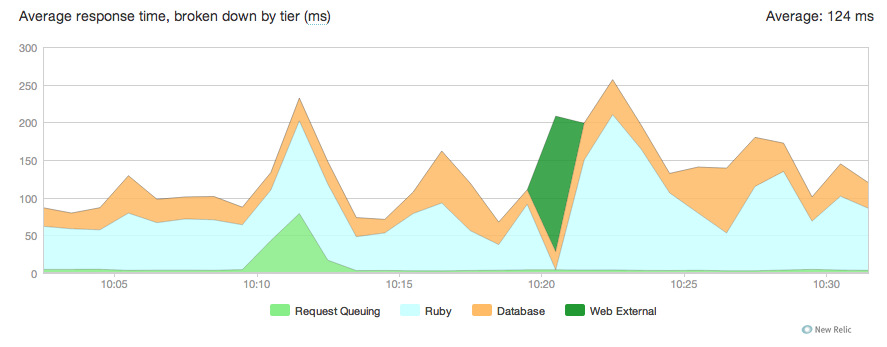
New Relic allows you to monitor, and drill into, the performance of your app over time. There are many cases in which a loss in availability is preceded by a degradation in service.
New Relic

Over a reasonable period of observation, establish normal operating boundaries for your application and set up alerts to notify you when your system is beginning to deviate from them.

Use New Relic’s rich graphing and performance analysis capabilities to better understand how your application behaves in certain circumstances and where it is most brittle. These observations can help you diagnose and work around degradations in periods of instability.

Log monitoring

The Heroku add-on marketplace includes many services that consume, store and provide instrumentation against your application’s log stream. By logging interesting events, like successful credit card signups, you can use these log services to alert you to unusual activity. When problems do arise, they also simplify debugging by allowing you to search the history of your log events.

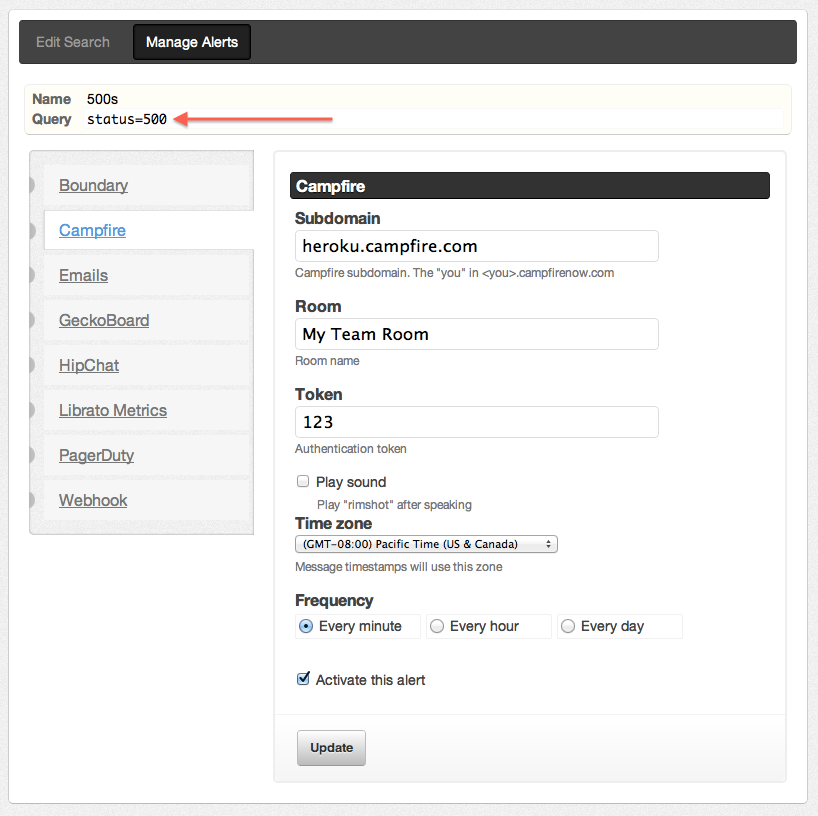
Papertrail is an example of a service that provides alerting based on patterns in your log data. Setup a search alert for errors and events within your app and integrate with Librato, PagerDuty, and Campfire. The search alert can be for Heroku error codes or interesting events in your app.
Papertrail

Keep reading

  • Monitoring & Metrics

Feedback

Log in to submit feedback.

Working with Heroku Telemetry Drains The Heroku Dashboard

Information & Support

  • Getting Started
  • Documentation
  • Changelog
  • Compliance Center
  • Training & Education
  • Blog
  • Support Channels
  • Status

Language Reference

  • Node.js
  • Ruby
  • Java
  • PHP
  • Python
  • Go
  • Scala
  • Clojure
  • .NET

Other Resources

  • Careers
  • Elements
  • Products
  • Pricing
  • RSS
    • Dev Center Articles
    • Dev Center Changelog
    • Heroku Blog
    • Heroku News Blog
    • Heroku Engineering Blog
  • Twitter
    • Dev Center Articles
    • Dev Center Changelog
    • Heroku
    • Heroku Status
  • Github
  • LinkedIn
  • © 2025 Salesforce, Inc. All rights reserved. Various trademarks held by their respective owners. Salesforce Tower, 415 Mission Street, 3rd Floor, San Francisco, CA 94105, United States
  • heroku.com
  • Legal
  • Terms of Service
  • Privacy Information
  • Responsible Disclosure
  • Trust
  • Contact
  • Cookie Preferences
  • Your Privacy Choices