Last updated July 21, 2026
The Heroku Scheduler Monitor add-on is currently in beta.

The Heroku Scheduler Monitor add-on natively monitors and investigates Heroku Scheduler jobs. Consult different types of metrics to diagnose issues on one-off dynos started by Heroku Scheduler.
This service is an extension of the existing app metrics provided in the Heroku Dashboard. You can configure threshold alerting to monitor one-off dyno-related issues. In addition to raw metrics and alerts, Scheduler Monitor provides guidance and recommendations on how to correct specific one-off dyno problems.
Scheduler Monitor is language-agnostic, so it can integrate with apps in any programming language. All features are accessible from the Scheduler Monitor dashboard.
Scheduler Monitor only considers metrics from detached scheduler one-off dynos started by Heroku Scheduler. It doesn’t include any other one-off dynos started by a user, for example via the Heroku Console.
Alert email notifications sent by Scheduler Monitor contain the one-off dyno’s command. Don’t put sensitive data directly in the command. Use config vars instead.
Provisioning the Add-on
Attach Scheduler Monitor to a Heroku app via the CLI:
See a list of all plans available here.
$ heroku addons:create scheduler-monitor
Creating one-off-metrics on sharp-mountain-4005... free
Your add-on has been provisioned successfully
After installing Scheduler Monitor, it’s fully integrated and configured. Scheduler Monitor doesn’t require or set any config vars. It picks up all relevant data automatically from your app.
Dashboard
Use the Scheduler Monitor dashboard to investigate Heroku Scheduler jobs running in your Heroku app’s environment as one-off dynos using different types of metrics. You can also create and manage the monitors for your Heroku Scheduler jobs.
You can access the dashboard via the CLI:
$ heroku addons:open scheduler-monitor
Opening scheduler-monitor for sharp-mountain-4005
Or by visiting the Heroku Dashboard and selecting the app in question. Select Scheduler Monitor from the Add-ons menu.
Gathered Metrics
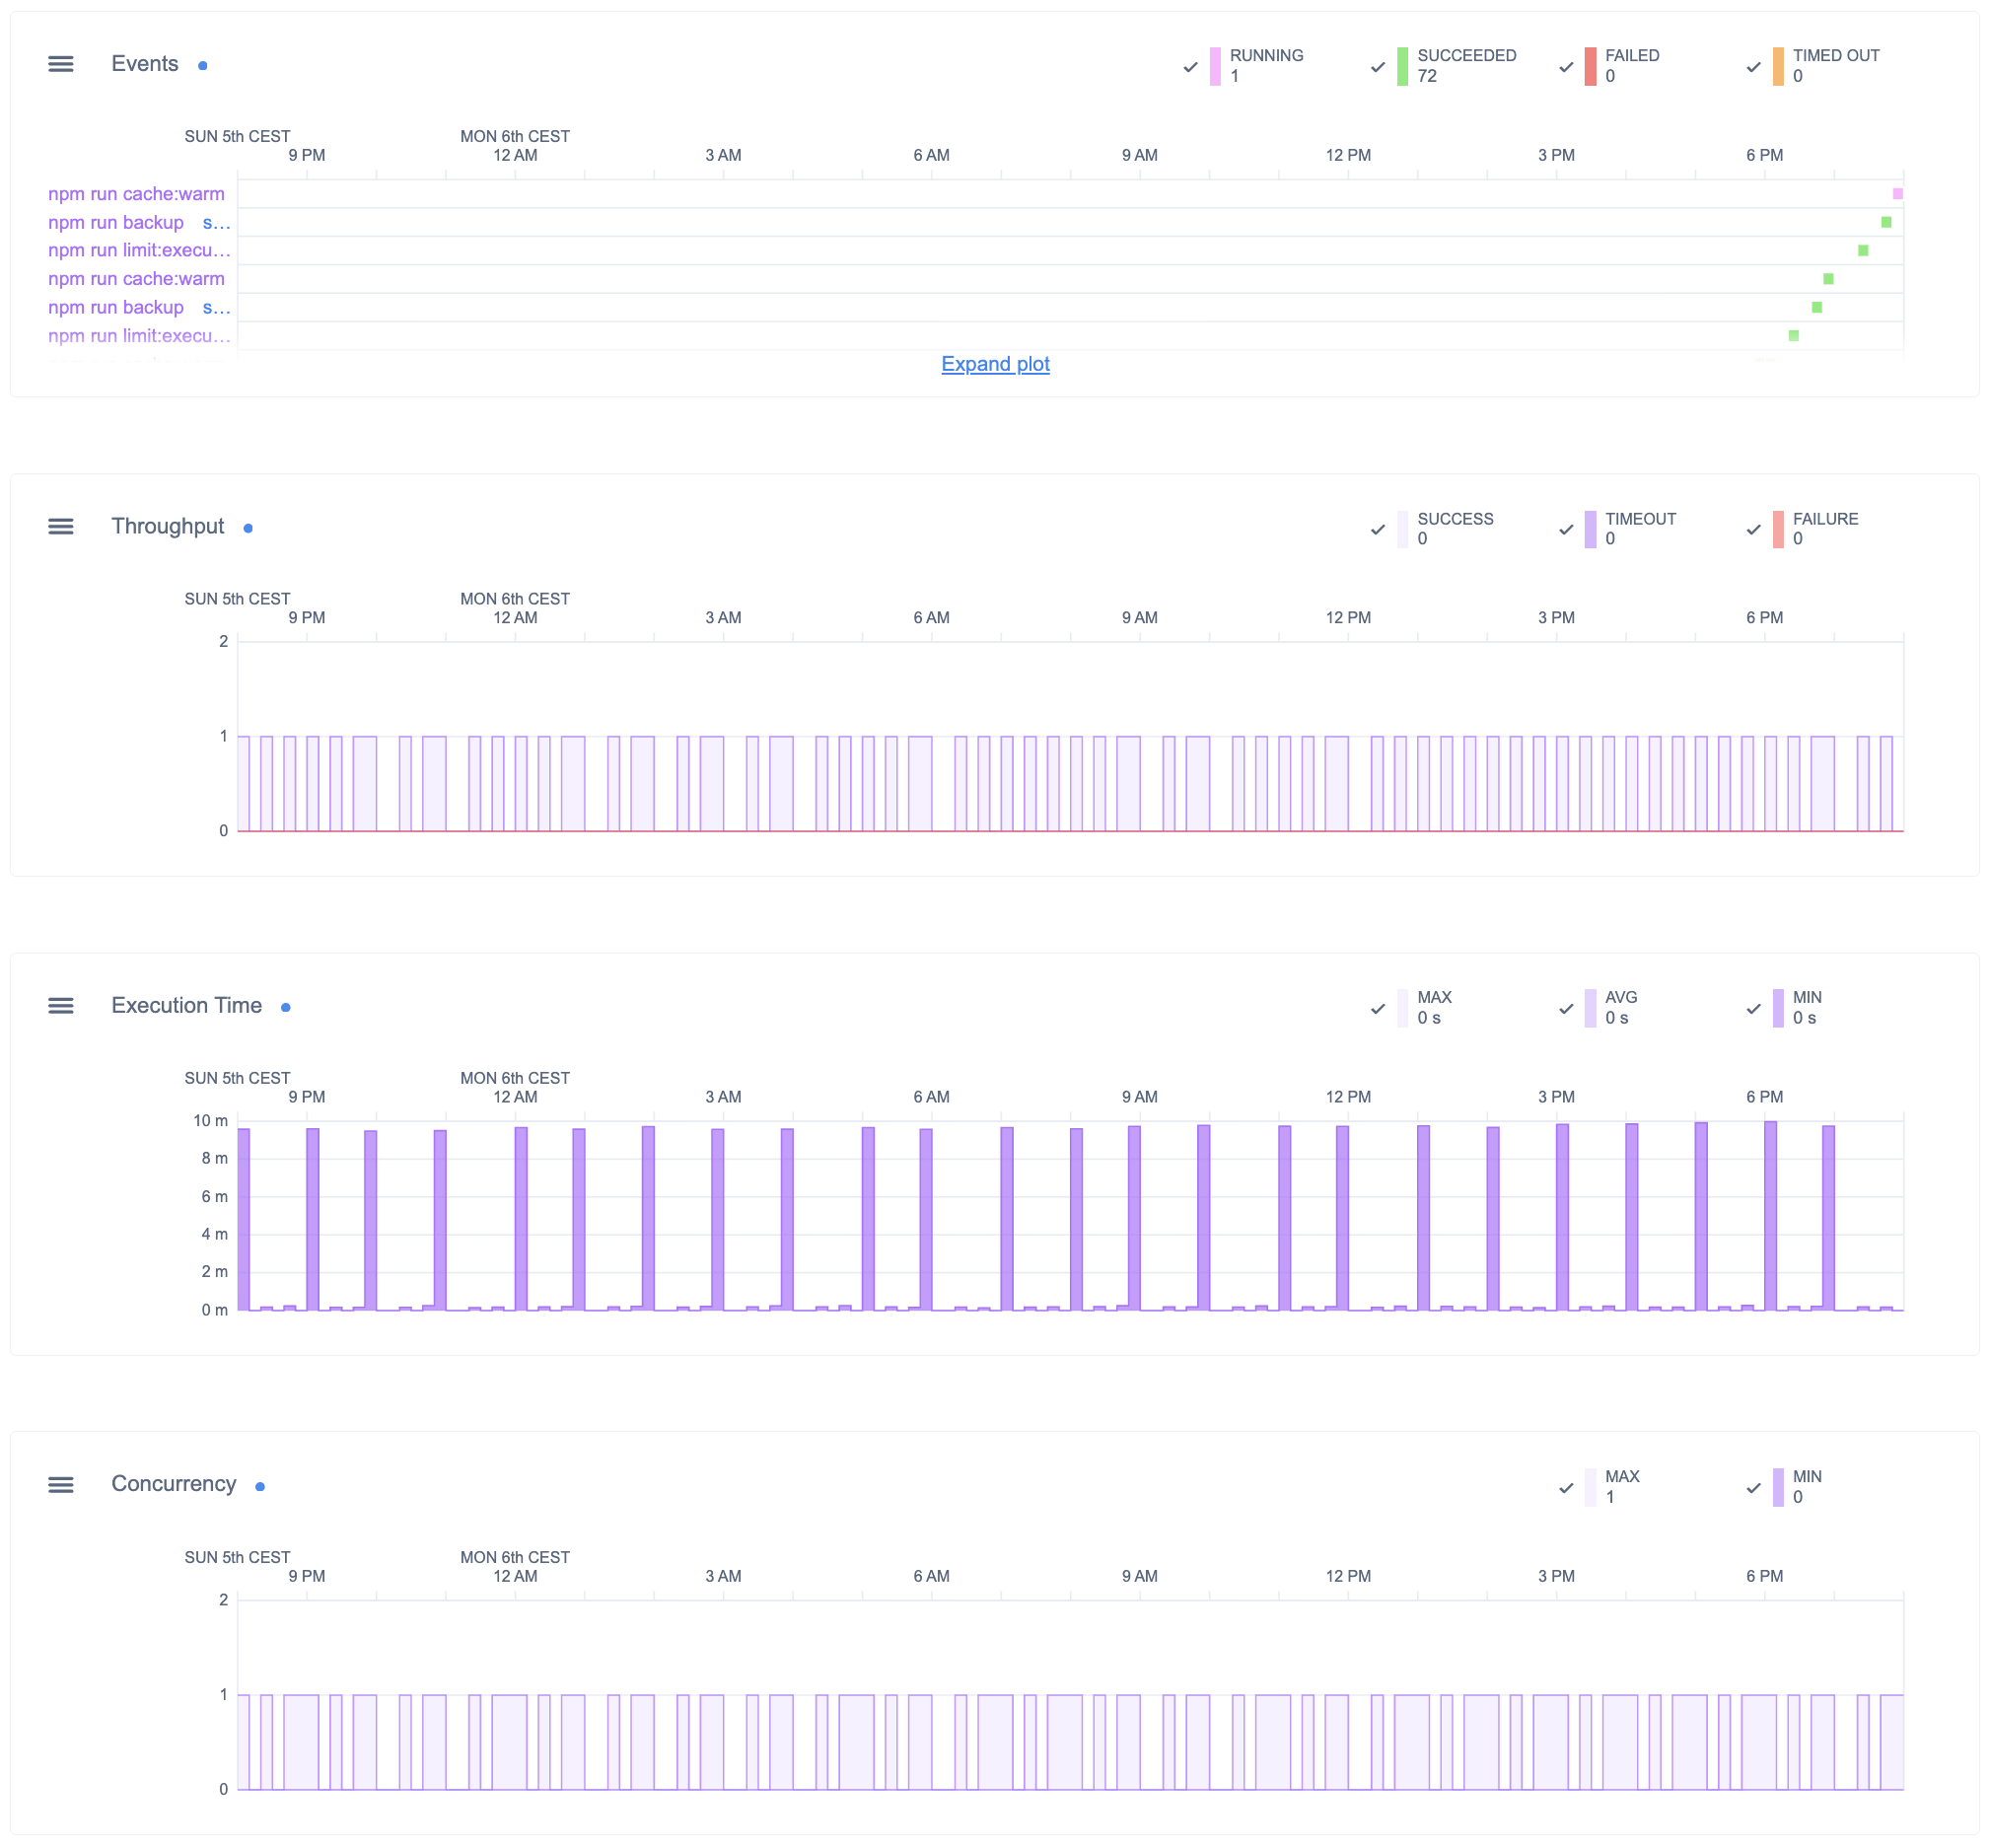
Events
The Event plot shows one-off dyno lifecycle events per specific one-off dyno.
Execution Time
The Execution Time plot shows summary metrics for one-off dyno execution times.
Throughput
The Throughput plot shows the number of one-off dynos broken down by exit status, either 0, null, or anything greater than 0. Scheduler Monitor considers:
- One-off dynos that result in a null status code as interrupted.
- One-off dynos that result in anything greater than 0 (zero) as failures.
- One-off dynos that result in a 0 (zero) status code as successes.
Concurrency
The Concurrency plot shows summary metrics of the number of one-off dynos running at the same time.
Data Resolution
There are 4 levels of data resolution in Scheduler Monitor:
- 1 minute (past 3 hours)
- 10 minutes (72-48 hours ago, 48-24 hours ago, and past 24 hours)
- 30 minutes (past 72 hours)
- 1 hour (past 7 days)
Data Filter
Use Scheduler Monitor to analyze the metrics data of a subset of your one-off dynos by filtering based on one-off dyno attributes.
Either filter only by command by providing part of the applicable command, or explicitly filter based on one or more specific attributes by using the attribute:value syntax.
Filtering through the input field in the dashboard applies to all plots at once. This ability correlates metrics data of different plots.
Attributes
| Name | Description | Example |
|---|---|---|
| command | command used to start this process | "python scrape.py" |
| state | status of this process one of: running, succeeded, failed, or interrupted |
"interrupted" |
| name | name of this process on this dyno | "scheduler.4321" |
| size | dyno size one of: standard-1X, standard-2X, performance-m, performance-l, private-s, private-m, or private-l |
"performance-l" |
You can use 2 different match types, an exact match, or a partial match. Exact matches include double quotes. For example, "standard-1X" only matches if it’s exactly equal to the test string. Partial matches, such as standard, don’t include double quotes and match if the test string contains the filter value.
Prepend - to exclude metrics data containing a certain test string. For example, -type:release, -state:succeeded, or -command:"python scrape.py".
Real-World Examples
To filter out metrics data related to one-off dynos running a command echo “Hello World!”:
echo "Hello World!"
To filter out one-off dynos running a command containing Hello World:
-Hello World
To filter out metrics data related to one-off dynos running a command echo “Hello World!” that either failed or were interrupted:
command:echo "Hello World!" state:failed state:interrupted
To filter out metrics data related to one-off dynos running a command echo “Hello World!” that did not succeed:
command:echo "Hello World!" -state:succeeded
To filter out metrics data related to one-off dynos of size Performance-L that are currently running:
state:running size:performance-l
To filter out metrics data related to one-off dynos that succeeded:
state:succeeded
To filter out metrics data related to a one-off dyno with a specific name:
name:scheduler.1234
Alternatively, filter metrics data in a specific plot by using the plot’s legend buttons. Doing so doesn’t affect the metrics data shown in the other plots.
Monitors and Threshold Alerting
Use Scheduler Monitor to create different types of monitors that check specific aspects of one-off dynos and open alerts based on various settings.
Alert email notifications contain the one-off dyno’s command. Don’t put sensitive data directly in the command. Use config vars instead.
Types of Monitors
Heroku Scheduler Job Failure
Monitor the one-off dyno exit status. Given a sensitivity setting of 1, this type of monitor opens an alert whenever a one-off dyno fails to execute a specific command successfully. Scheduler Monitor considers an exit status greater than 0 (zero) as a failure.
Heroku Scheduler Job Interruption
Monitor whether a one-off dyno fails to exit on its own. Given a sensitivity setting of 1, this type of monitor opens an alert whenever something forces a one-off dyno executing a specific command to exit.
Heroku Scheduler Job Execution Time
Monitor the one-off dyno execution time. Given a sensitivity setting of 1, this type of monitor opens an alert whenever a one-off dyno takes longer to execute a specific command than your threshold setting.
Heroku Scheduler Job Concurrency
Monitor the number of one-off dynos started by a specific Heroku Scheduler job. Given a sensitivity setting of 1, this type of monitor opens an alert whenever the number of concurrent one-off dynos is at or exceeds your threshold setting.
Heroku Scheduler Concurrency
Monitor the total number of scheduler one-off dynos running inside your Heroku app’s environment. Given a sensitivity setting of 1, this type of monitor opens an alert whenever the total number of concurrent one-off dynos is at or exceeds your threshold setting.
Monitors exist independently from one another. A single one-off dyno can meet the alert conditions of different monitors, setting off multiple alerts.
Sensitivity Setting
You can configure a sensitivity setting for every monitor. This setting determines how many consecutive times a monitor must meet the alert conditions before actually opening an alert.
Alert Notifications
By default, the distribution for email notifications is to all app owners and collaborators for non-team accounts, and admins for people in a Heroku team. Alternatively, you can add multiple email addresses, such as for email-based PagerDuty integration.
Although Scheduler Monitor supports multiple addresses, the preferred approach is to use your email platform to create an alias. You can manage group membership outside of the alert notification framework.
Migrating Between Plans
App owners must carefully manage the migration timing to ensure proper app function during the migration process.
Use the heroku addons:upgrade command to migrate to a new plan.
$ heroku addons:upgrade scheduler-monitor:newplan
-----> Upgrading scheduler-monitor:newplan to sharp-mountain-4005... done, v18 ($49/mo)
       Your plan has been updated to: scheduler-monitor:newplan
Troubleshooting One-Off Dyno Issues
Scheduler Monitor lets you monitor one-off dynos used by Heroku Scheduler to run your scheduled jobs. One-off dynos are dynos that run a specific command until it exits. They run alongside other dynos, exactly like the app’s web, worker, and other formation dynos. One-off dynos are ideal for performing one-off administrative or maintenance tasks for your Heroku app.
Here’s how to troubleshoot some of the most common issues with working with one-off dynos.
One-Off Dyno Failures
Whenever a one-off dyno exits with an exit status greater than 0 (zero), it’s considered as a failure. There can be several reasons why a one-off dyno exits with an error code:
- Issues can occur during the provisioning of the one-off dyno. Check your one-off dyno’s app logs for any information, as these issues get logged most of the time.
command not foundin your one-off dyno’s app logs indicates that the command provided for the one-off dyno doesn’t exist. Did you make a typo or forget to push your changes to your Heroku app’s environment?- Check for app-level errors. Review your one-off dyno’s app logs for any errors, warnings, or additional information. Try to reproduce it locally and start debugging from there.
One-Off Dyno Interruptions
Whenever something forces a one-off dyno to exit instead of exiting on its own, Scheduler Monitor considers it as interrupted. Sometimes this forced exit is harmless, for example, when a user kills the one-off dyno using the Heroku CLI.
A forced exit can also mean that your one-off dyno keeps running indefinitely until it reaches its TTL (time-to-live). Upon creation, a one-off dyno gets a TTL value assigned in seconds. Heroku automatically kills the dyno after the number of seconds passes.
This example shows what appears in your one-off dyno’s app logs when Heroku kills a dyno in this way:
Cycling
State changed from up to complete
Stopping all processes with SIGTERM
Process exited with status 143
The one-off dyno’s command either took longer to run than its TTL, or it failed to exit on its own after performing the required actions. Test your command locally and make sure it exits properly before running it using a one-off dyno.
When using the Heroku Scheduler add-on, it creates a one-off dyno with a TTL value that is equal to the job’s interval. For example, for a job executed every 10 minutes, it creates one-off dynos with a TTL value of 600 seconds (10 minutes).
Removing the Add-on
You can remove Scheduler Monitor via the CLI:
This action destroys all associated data and you can’t undo it!
$ heroku addons:destroy scheduler-monitor
-----> Removing scheduler-monitor from sharp-mountain-4005... done, v20 (free)
Support
Submit all Scheduler Monitor support and runtime issues via one of the Heroku Support channels. Any non-support issues or product feedback is welcome at support@schedulermonitor.com.